


Triple Whale (TW) 3.0: Quick Setup Guide for DTC and eCommerce CEOs
Monitor the KPIs that matter most for top-level decision making.

#1 reason your e-commerce brand isn’t growing to its full potential:
DECISIONS.
As the Owner/Operator of an eCommerce brand, the biggest levers you can pull are your DECISIONS.
Beyond knowledge and experience, better decision-making requires
VISIBILITY INTO BETTER DATA.
✅ Easy to find, understand, and interpret without any technical knowledge or skills.
✅ Centralised access to data from all platforms.
✅ Auto-updated Dashboards with Key KPIs
Examples of Reading Data Wrong
I loved this post from Sarah:

Many times I need to play the tough role of pointing out the loopholes in reporting. New agency reported improvement in Blended CPA & MER. At the cost of lower top line from our baseline to sustain production cost.
Top line improved with improved blended CPA. At the cost of not acquiring new customers.
Top line improved, with improved blended NCPA. At the cost of massive discounts bringing down the margins.
It’s so important to have the right data interpretation framework in place.
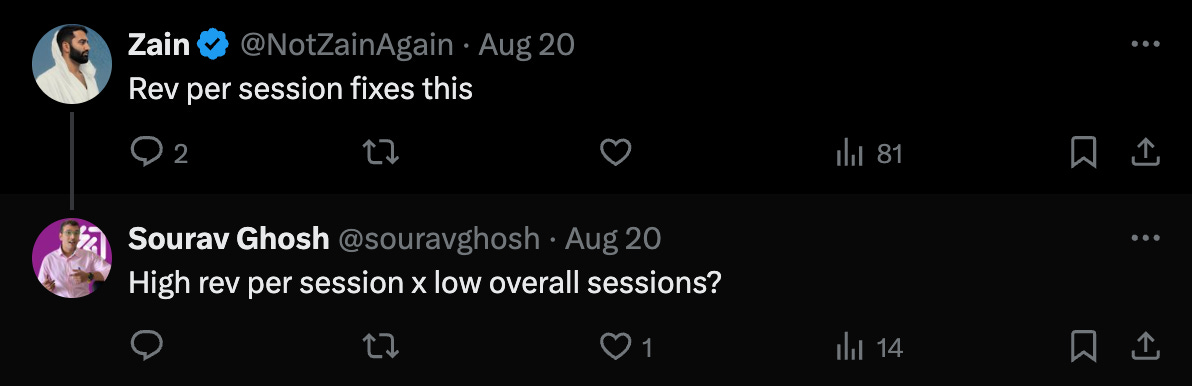
And the key is to:
NOT looking at a single metric to drive decisions
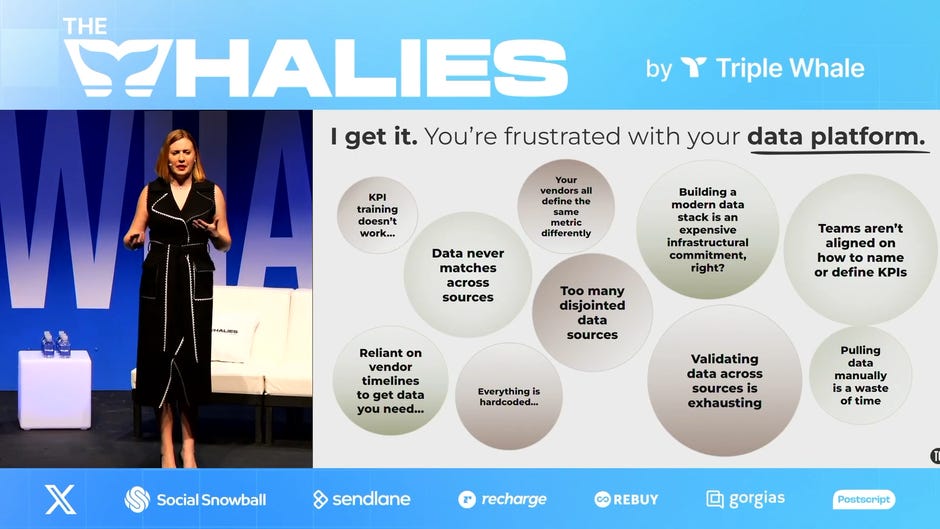
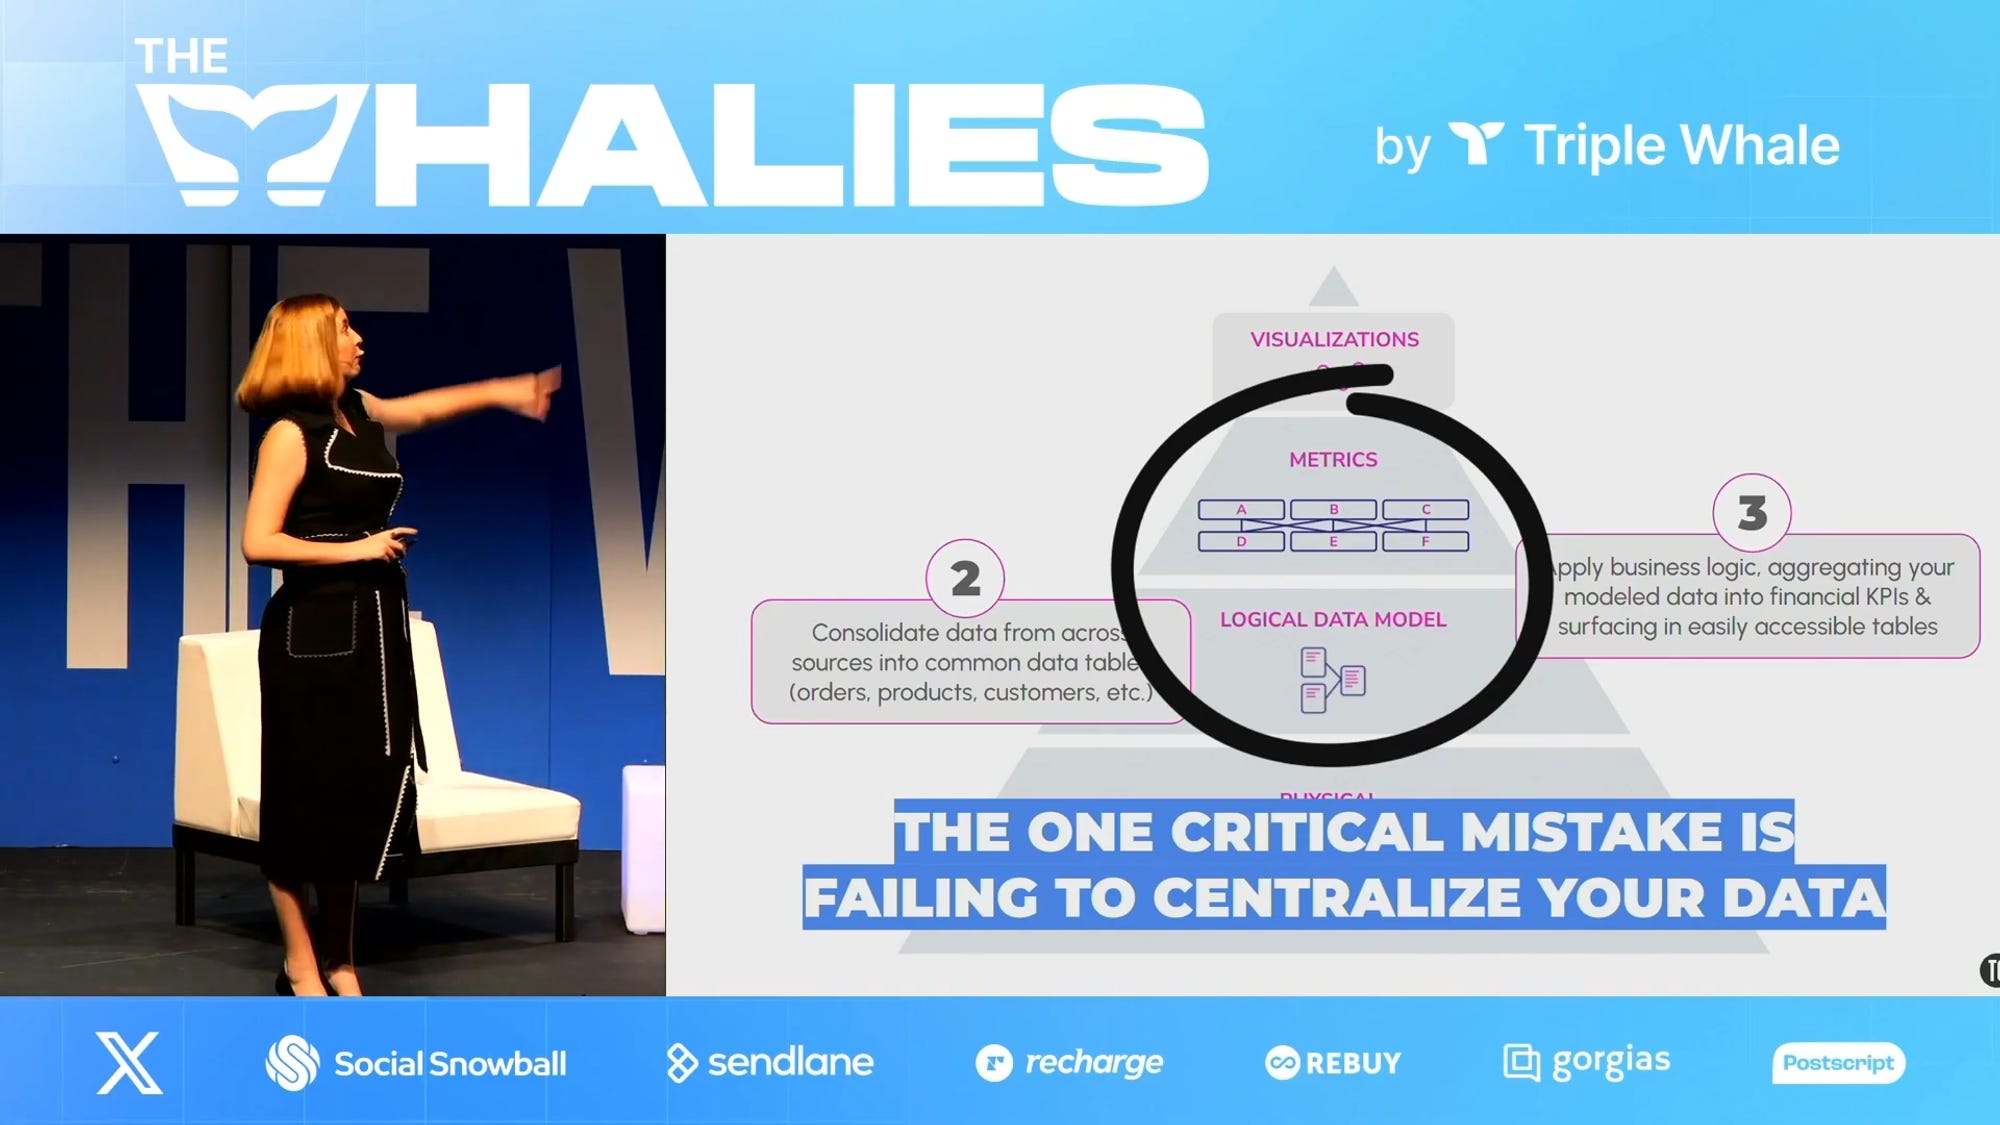
The Data Platform DTC Disruptors Need
This is the best presentation I’ve found so far on the importance of building better data infrastructure for your DTC brand.
Here is a quote from the video that I love:
“Executive decision makers can't make the right decisions if they don't have the right information.
And if those executive decision makers don't have the right information, it's because their data doesn't work the way that they think.
So I see my job as translating decision makers' brains into data platforms.”
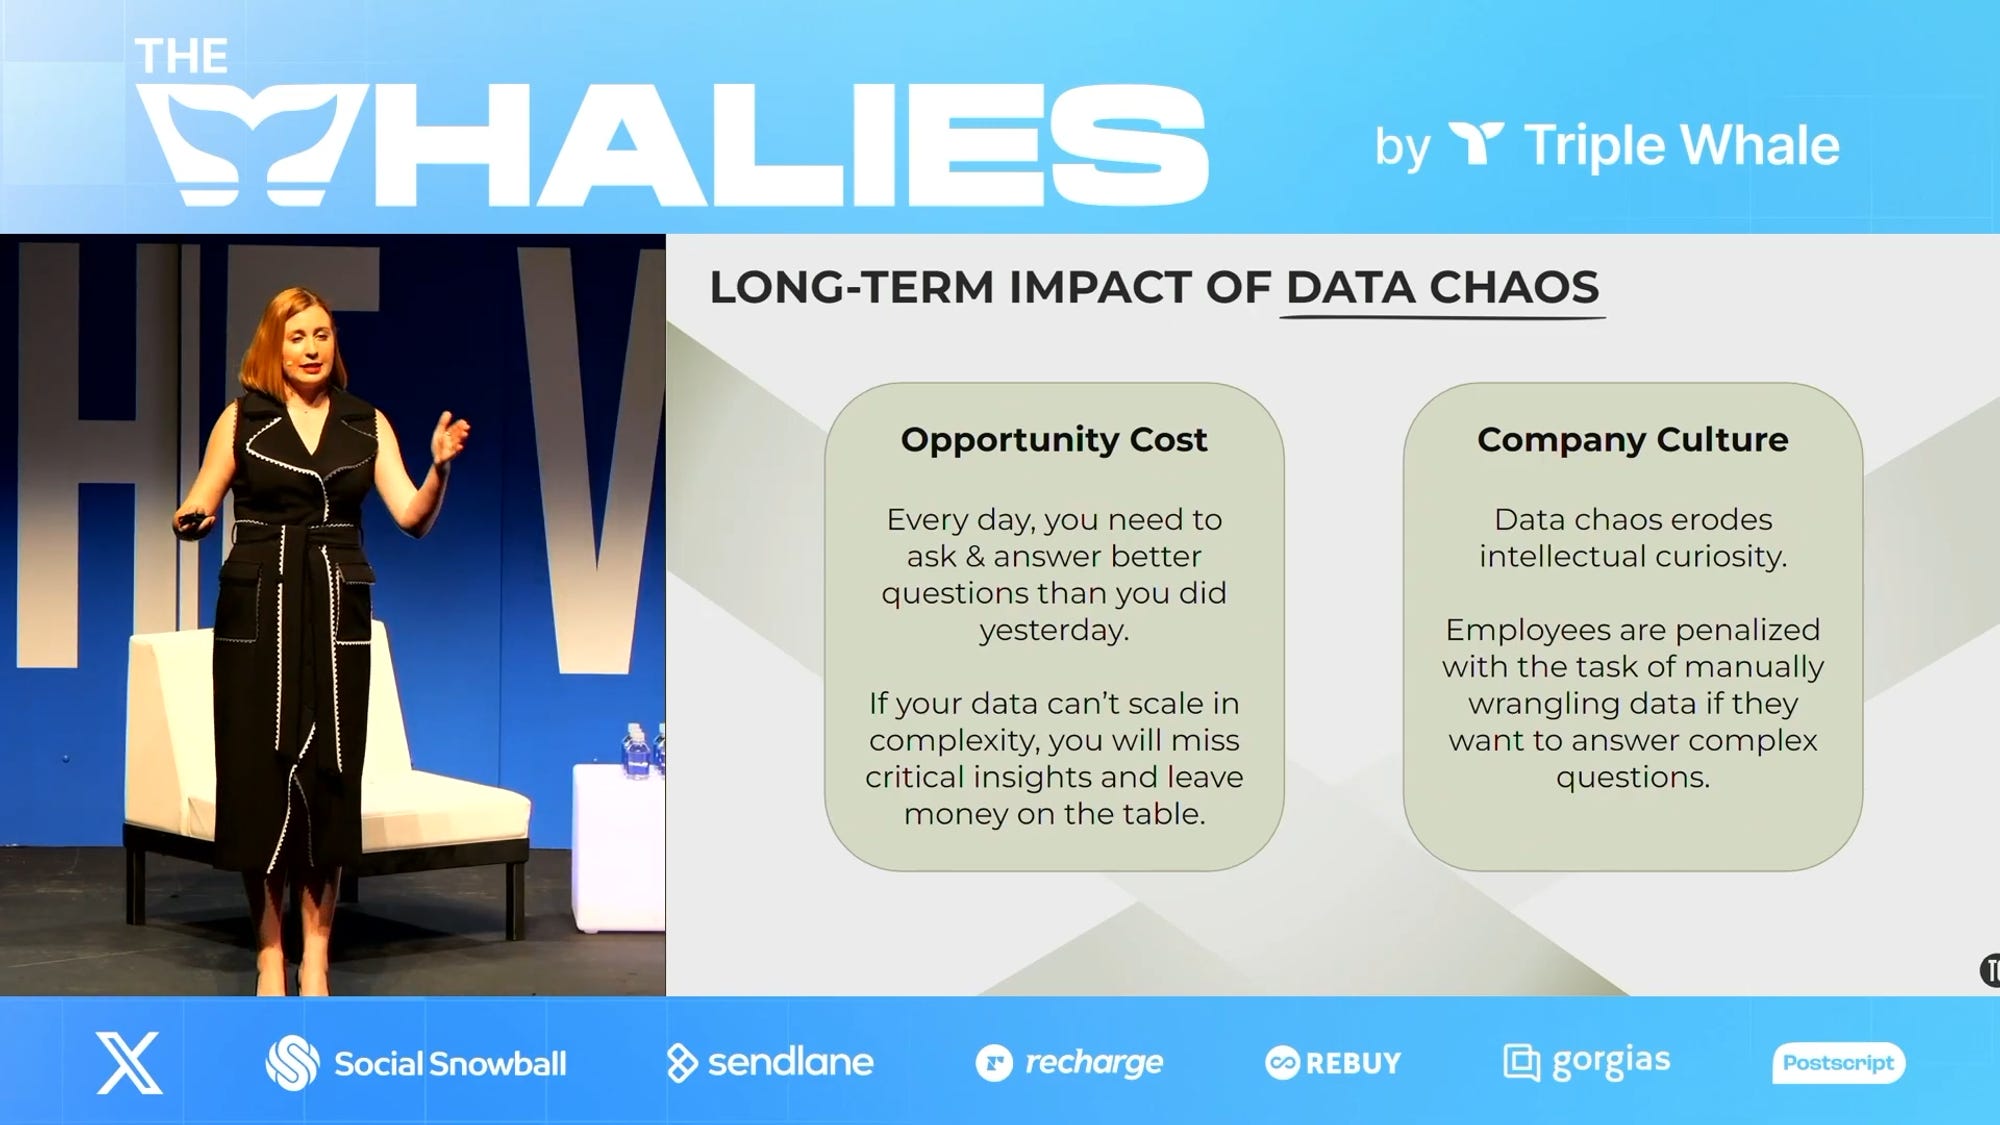
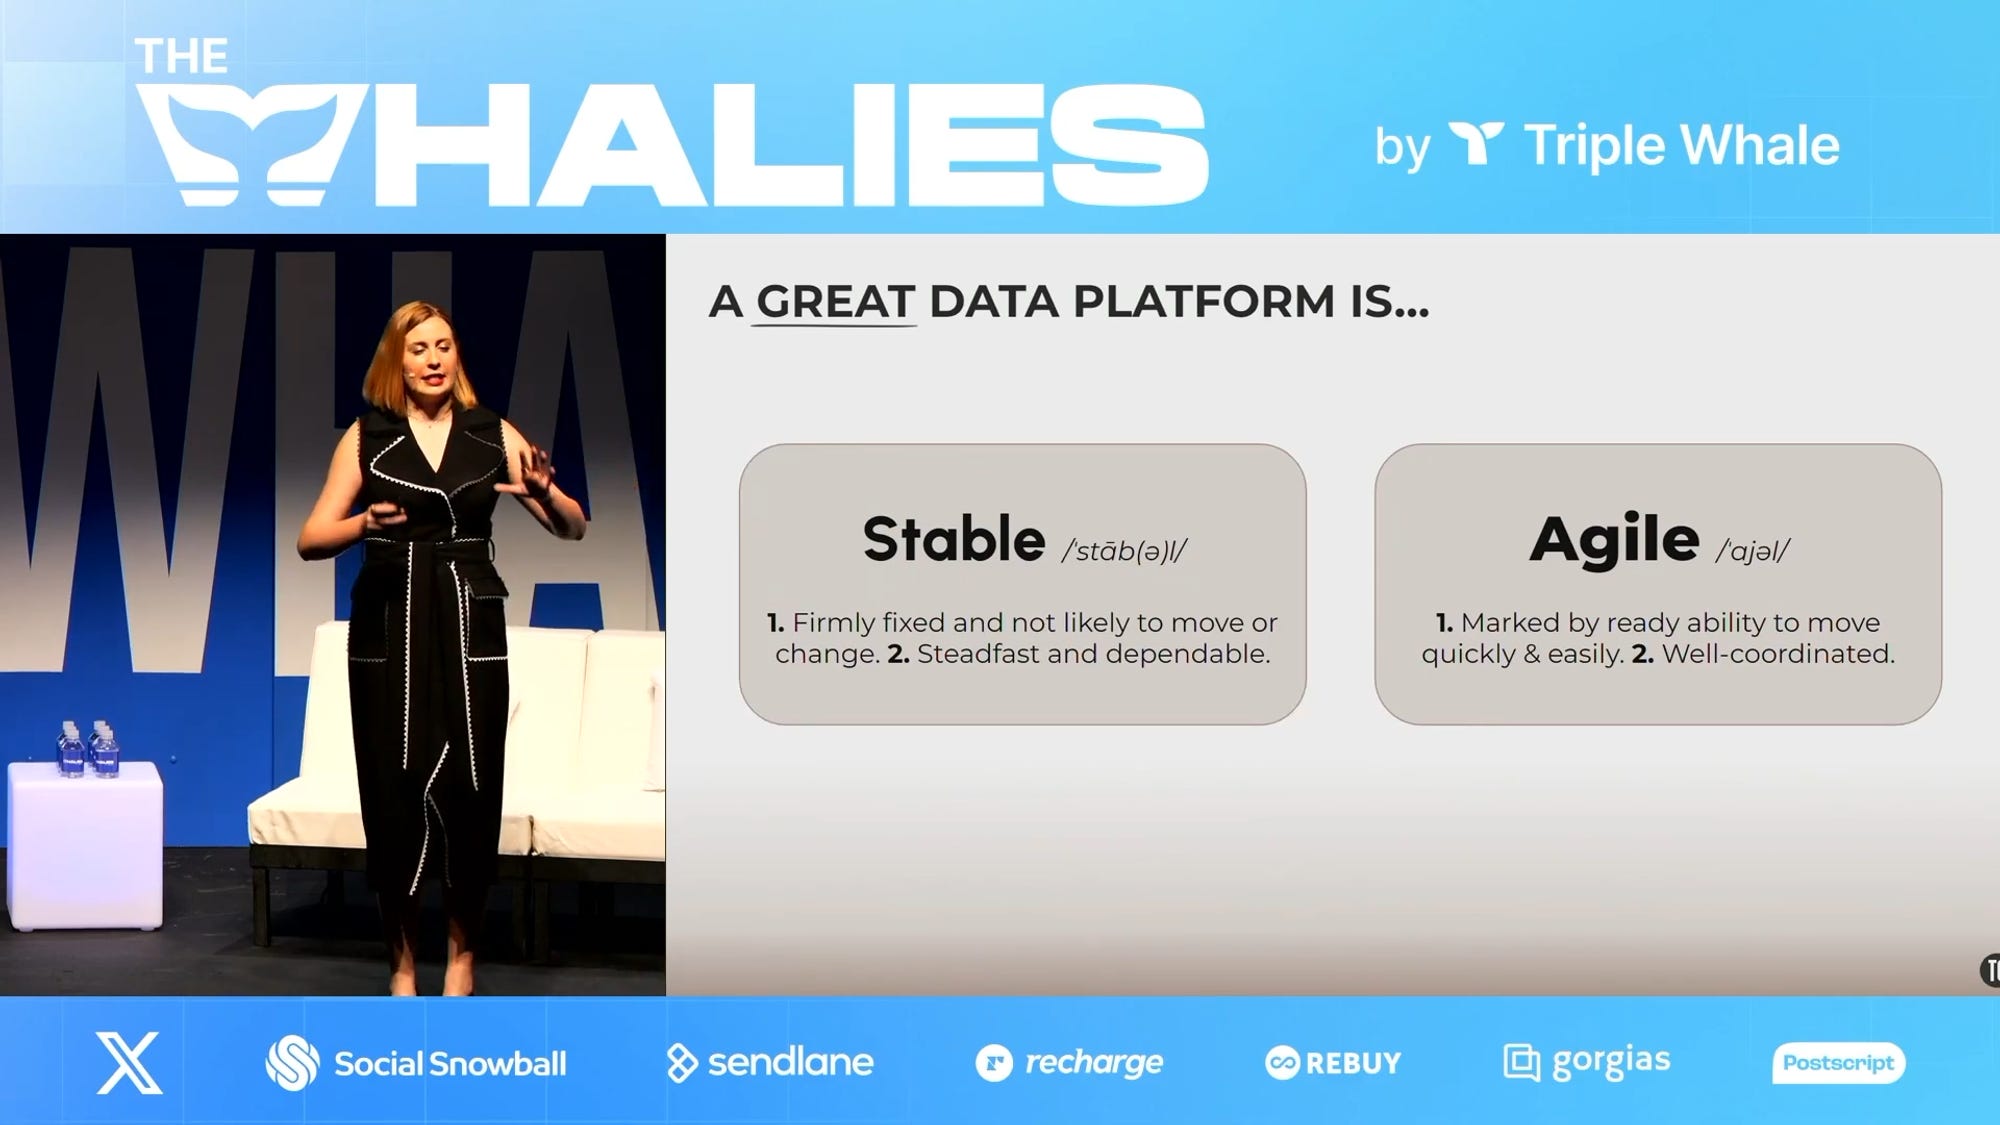
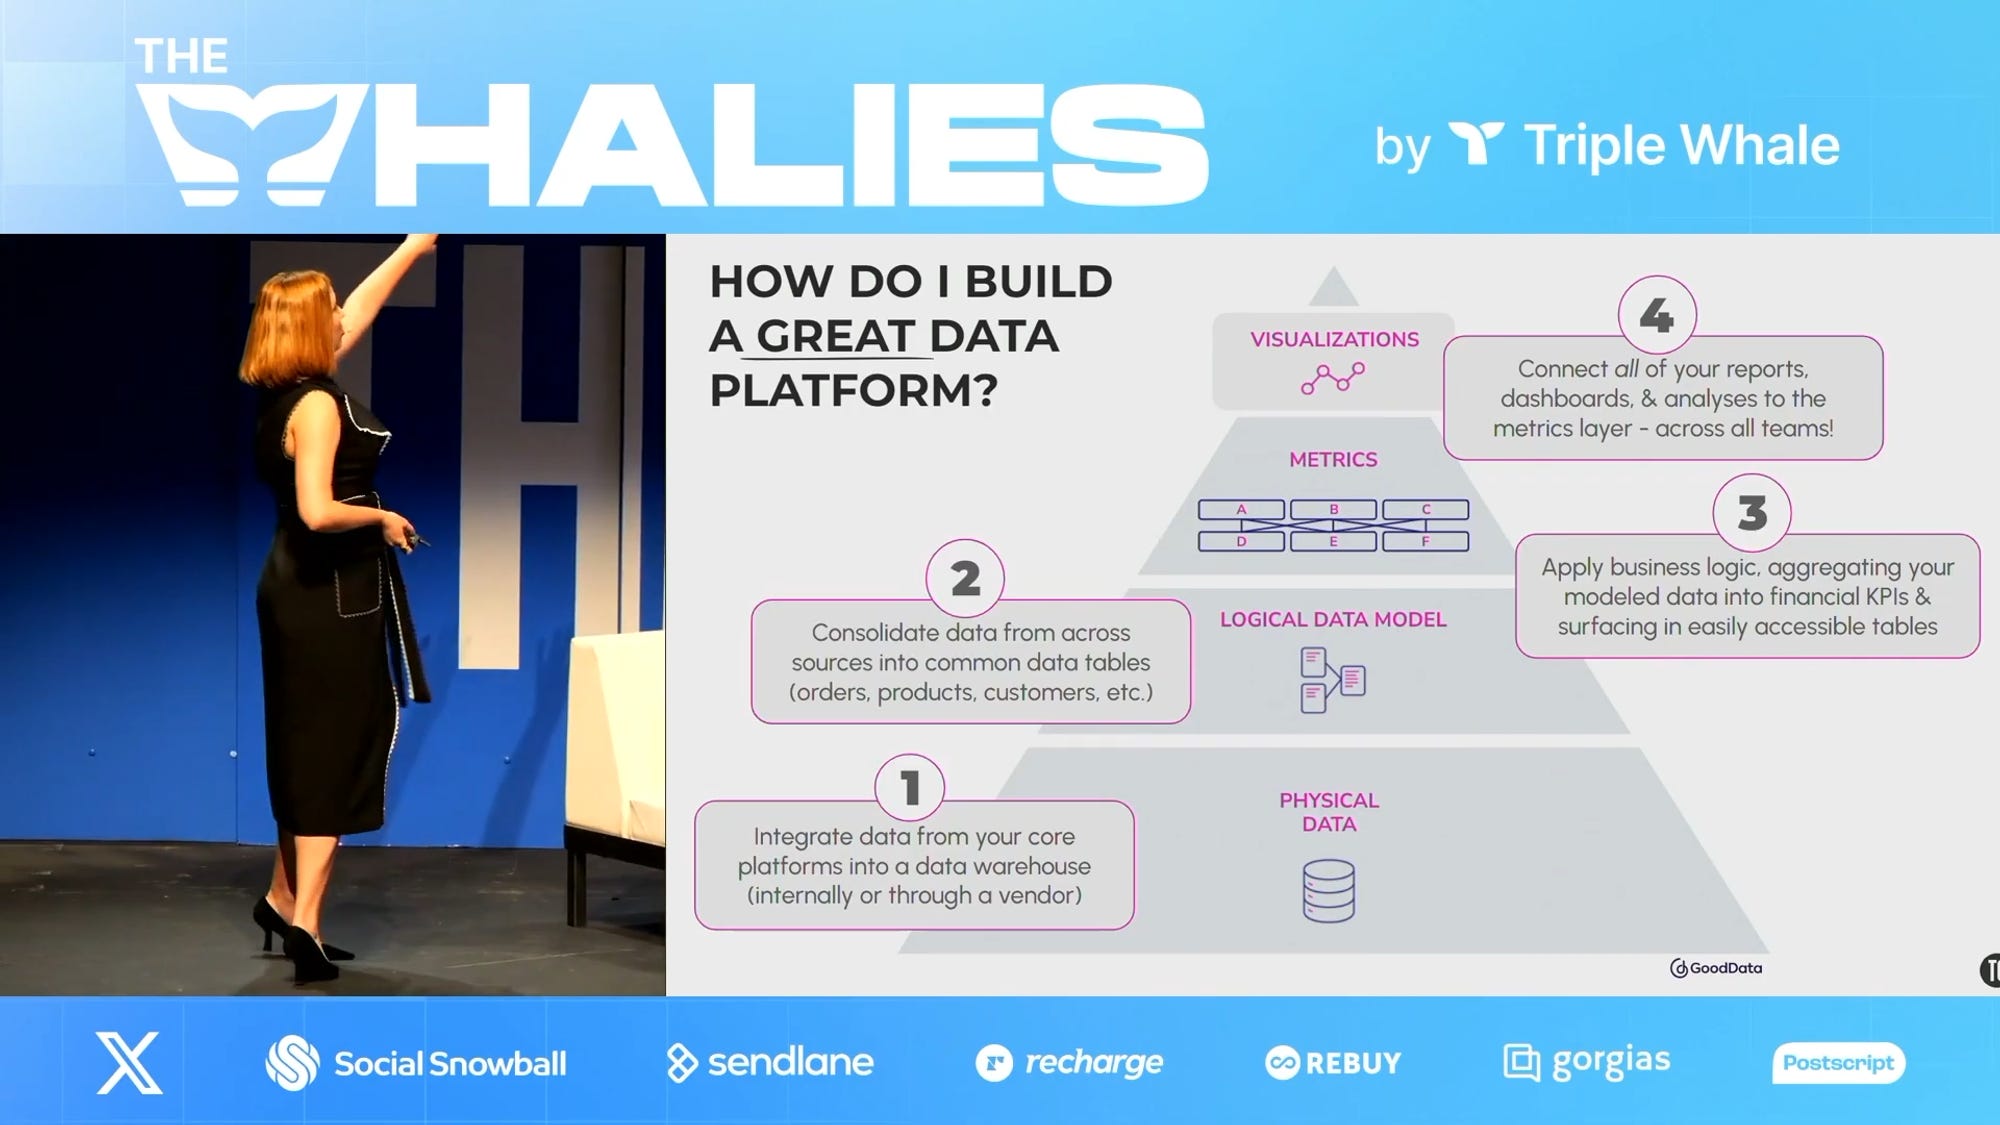
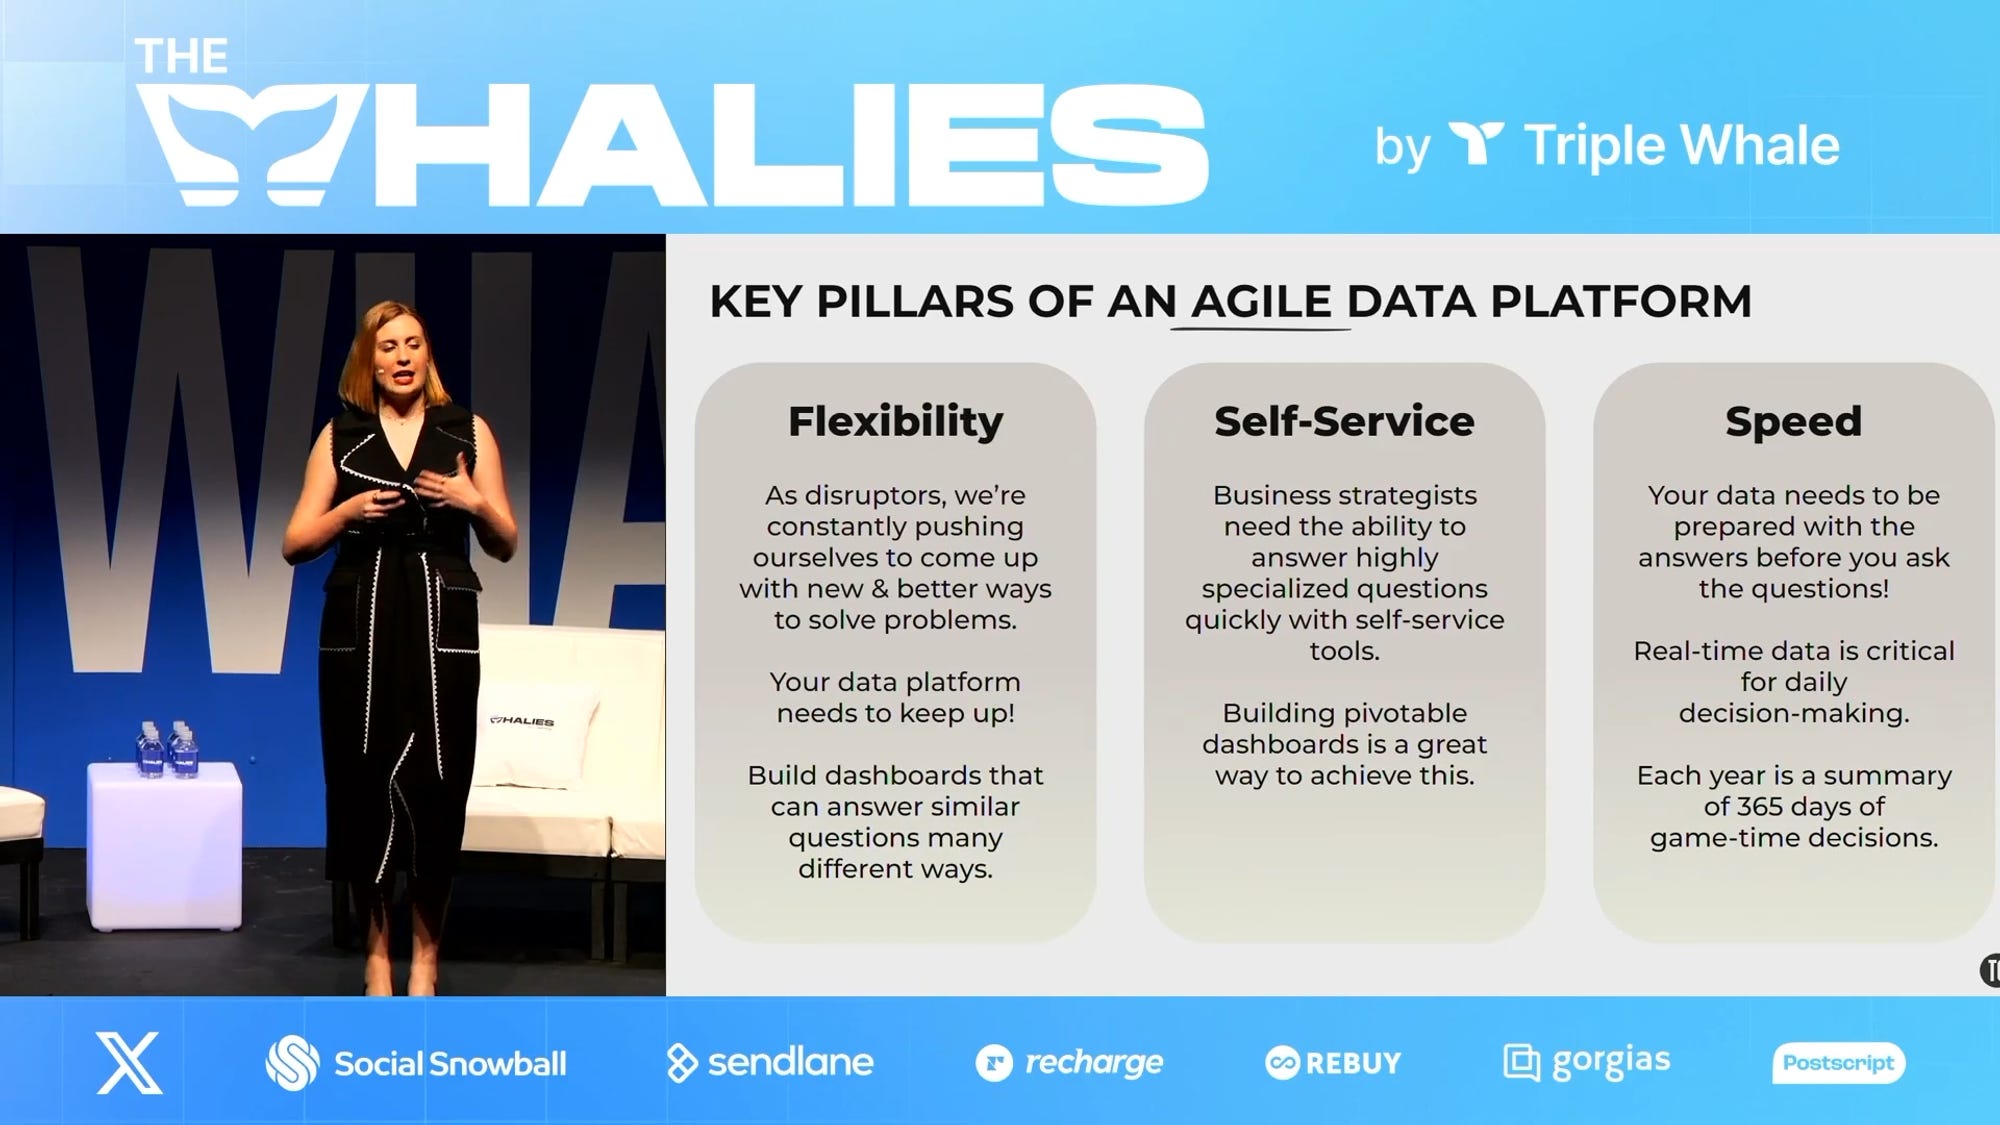
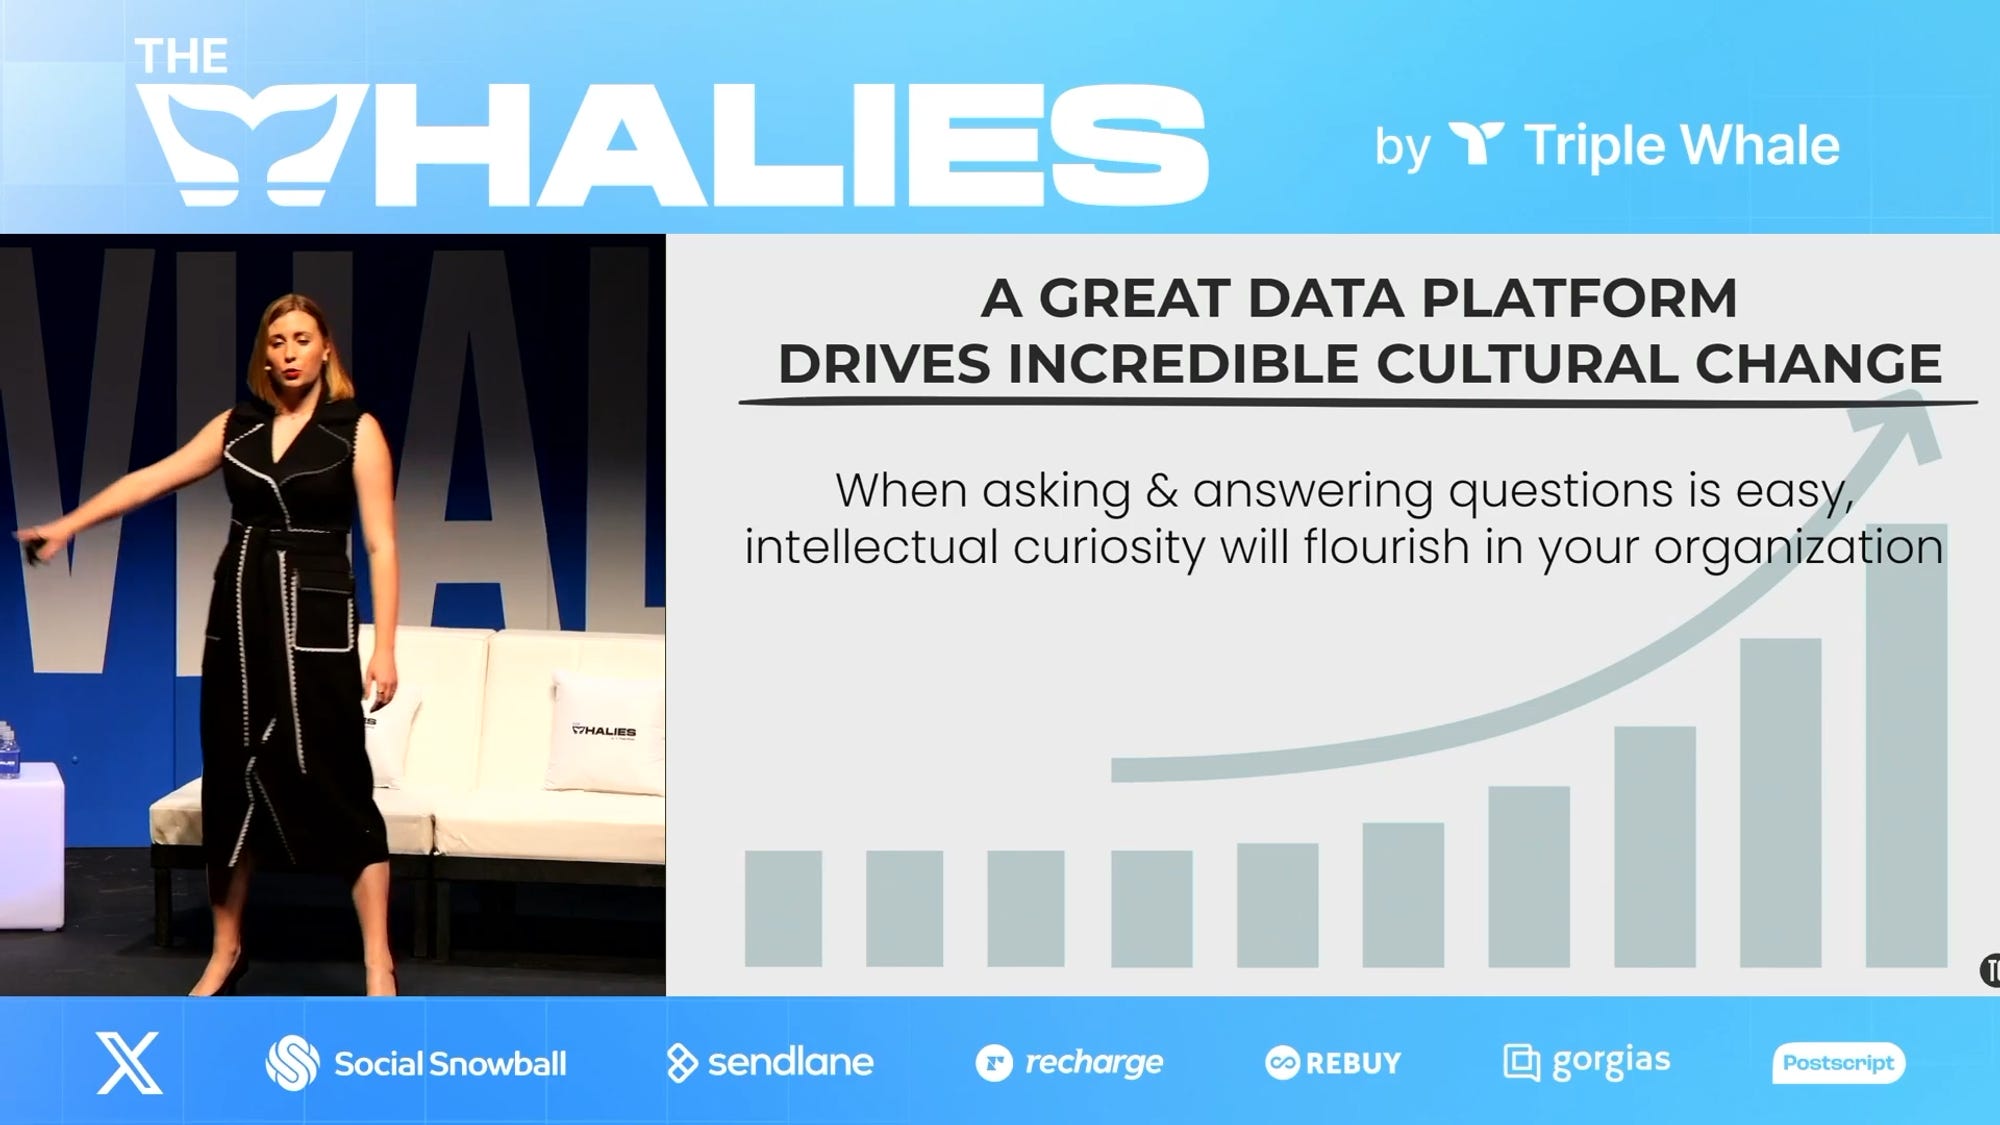
And a few slides to highlight:
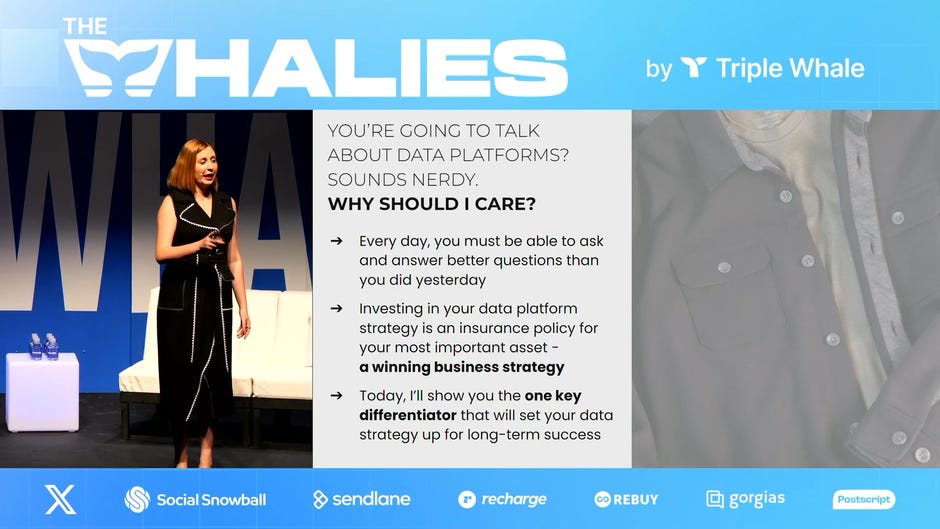
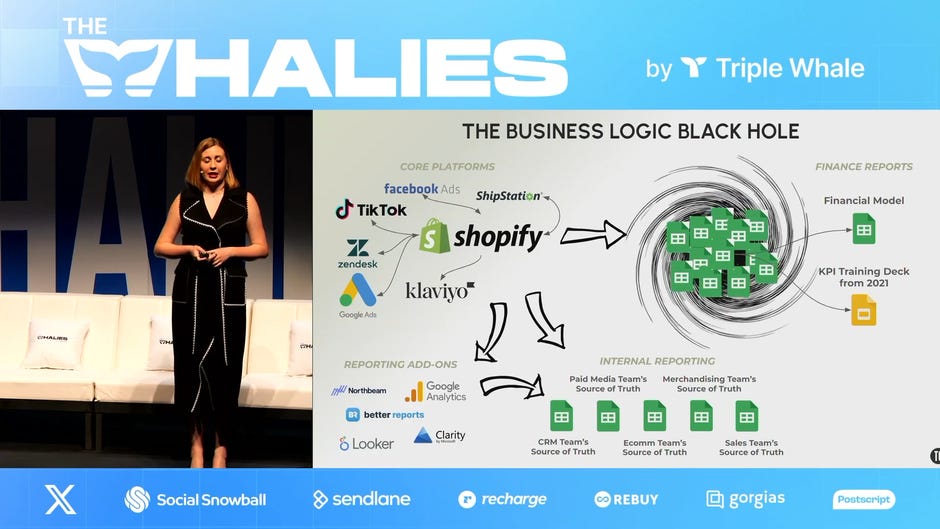
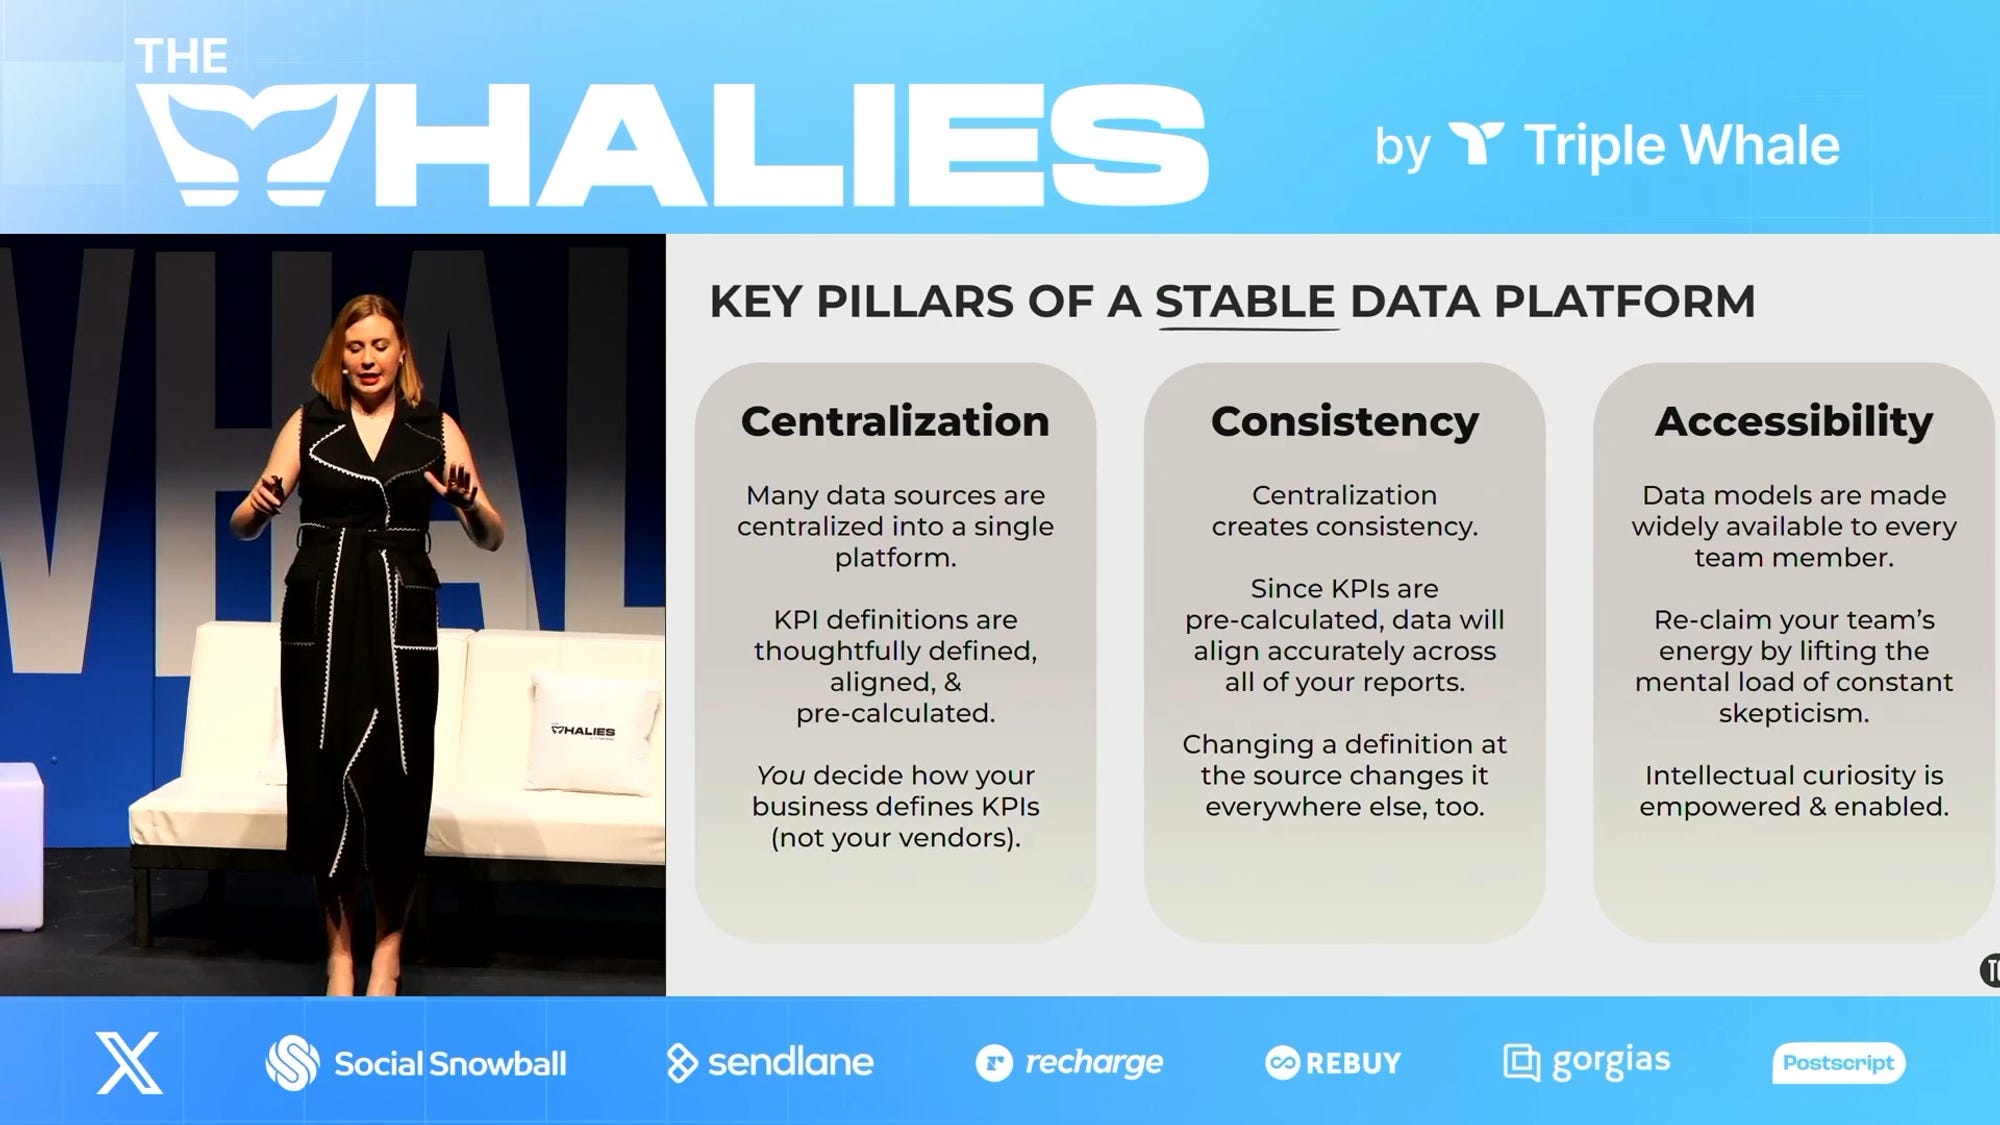
In case I fail to convince you of the importance of having a strong data culture, with my experience working with 7-figure DTC brands over the last decade, I wanted to back my recommendations up with someone like Christina, leading marketing & data science at a 9-figure DTC brand, True Classic.
Building a data platform in-house would not be practical or economical for most eCommerce brands.
But you are suffocating yourself, your team, and your brand if you are still using:
GA4 or platform-specific reporting for key decisions
Multiple spreadsheets
Vanity metrics like ROAS without checking Finance & Unit Economics
People to analyze & visualize data that AI can do way better
That’s where Triple Whale (the current TW 3.0) saves the day.
What is Triple Whale?
If you're hearing about it for the first time or have tried earlier versions and stopped, I highly recommend exploring its current capabilities.
I have been using the platform since the beginning of 2024, having early access. Leading the marketing & growth initiatives for the 7-figure DTC brand I was working with would have been much more difficult without this platform.
I’ll let the co-founder of Triple Whale explain in his own words:
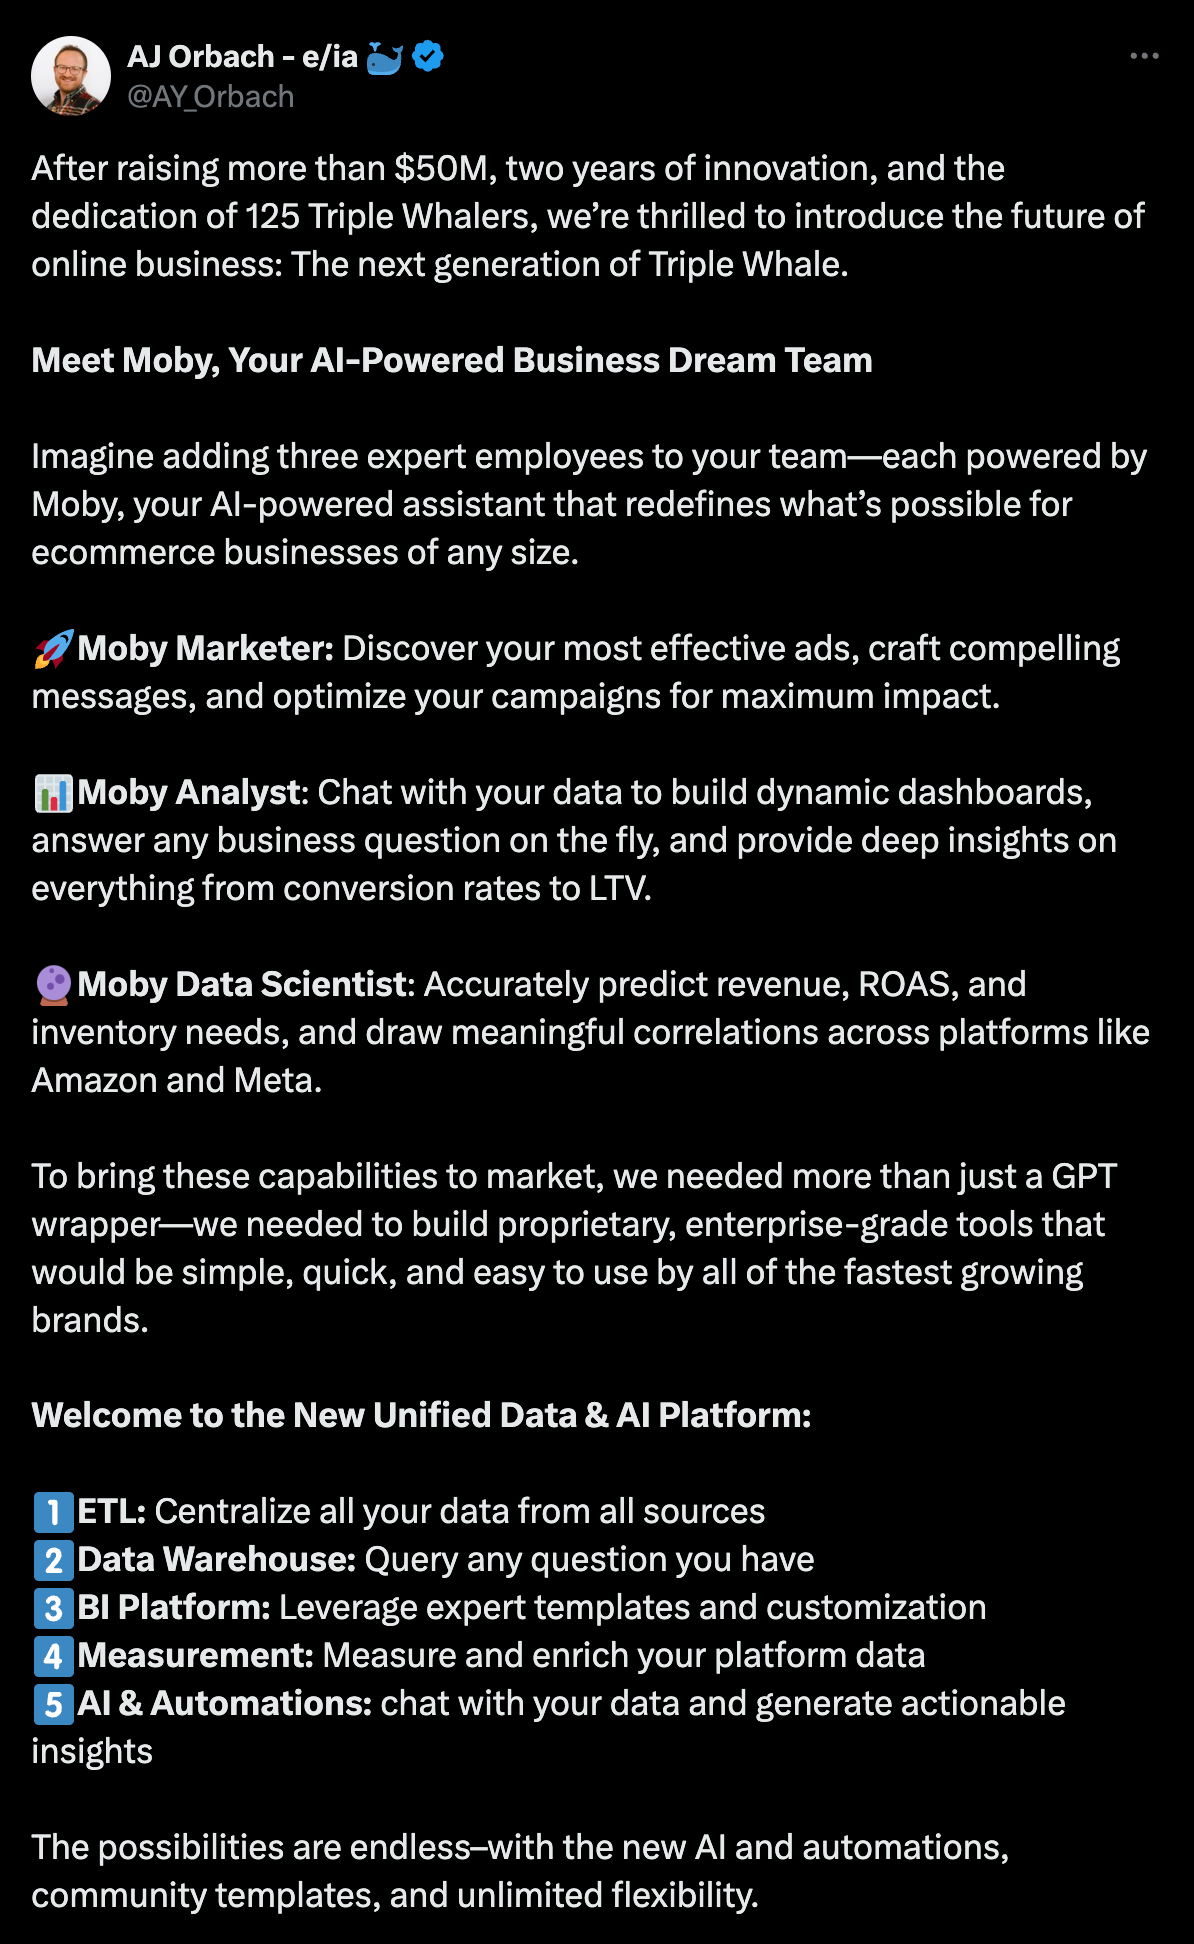
1 Unified Data & AI Platform with:
All your data sources connected & centralized (more reliable than single isolated platform reporting)
Business Intelligence (BI)
Analytics, Measurement (replaces GA4)
Data Enrichment (Triple Whale’s Sonar replaces CAPI tools like Elevar, UpStackified etc)
Multi-Touch Attribution (MTA)
Dashboards
AI Assistant (Trained with your Business Data)
Automation
Templates
and more.
Getting Started with Triple Whale
Find more details, get a demo, or sign up.
The Triple Whale team is one of the best SaaS teams I've had the privilege to work with for years.
I am sure you’ll have an amazing experience.
However, in highly unlikely scenario, if you face any issues, don’t hesitate to reach out to me @souravghosh on X or Instagram.
Learn to Create Reports
🔗 Creating Custom Reports | Report Guides
Triple Whale Setup Guide for Owners / Founders / Operators / CEOs
While Triple Whale provides visibility into useful metrics, right out of the box and even more with a vast collection of templates, it can be overwhelming & confusing.
Also, it can make you lazy, as Ron (8-figure brand Obvi CEO) pointed out in his post, being over-reliant on certain metrics while ignoring others.

Here is WHY you need to understand EVERY Metric (Timestamp 19:00) extends on the above. And I agree with the speakers and want to remind you
These CEO Dashboards and metrics in them, are for you to quickly spot issues to spark a conversation with your team, leading to hopefully digging deeper into data.
Not to take knee-jerk impulsive actions.
Now let me help you to track and interpret the right KPIs for high-level conversations & decision-making.
That’s where I start with every new DTC brand I work with.
Let me walk you through setting up three dashboards that will immediately support your decision-making.
Summary Page
Usually, I keep 3 sections for me and the Owner/CEO I am working with:
Finance

Metrics Per Order

Metrics Per Customer

I find these metrics incredibly helpful for top-level decision-making to drive profitable growth.
I usually use numbers from the Summary page to create Waterfall Charts 👇
Simplifying DTC Financials with Waterfall Charts

Running a DTC brand without crystal-clear financial insights is like flying blind. Unfortunately, this is a reality I encounter all too often—even with 7-figure brands. Whether you're just scaling up or already established, lacking transparency in your financials can lead to costly mistakes and missed opportunities.
Visualization: Monthly KPIs (Static Dashboard)
Next, I set up a static board with visualizations of monthly key 🔑 KPIs for past years to the current date.
Without this 'big picture' zoomed-out view, I have often seen wrong interpretations & decision-making.
Factoring in long-term trends, seasonality, etc gives better context.


Usual KPIs (by month) I add here:
Total Sales / Order Revenue
Ad Spend
Meta Ads Spend
OPEX
Net Profit
Customer Order Analysis (new vs returning)
Customer Revenue Analysis (new vs returning)
MER
aMER
Blended CPA & NCPA
Meta Ads CPM and CPA
Conversion Rate
Organic Revenue (Triple Attribution)
New & Returning Visitors Sessions
Revenue reported by Channels (Ad Platforms, Email/SMS, etc)
Refund Amount
Order Numbers
Unique Visitors
Cost per Session
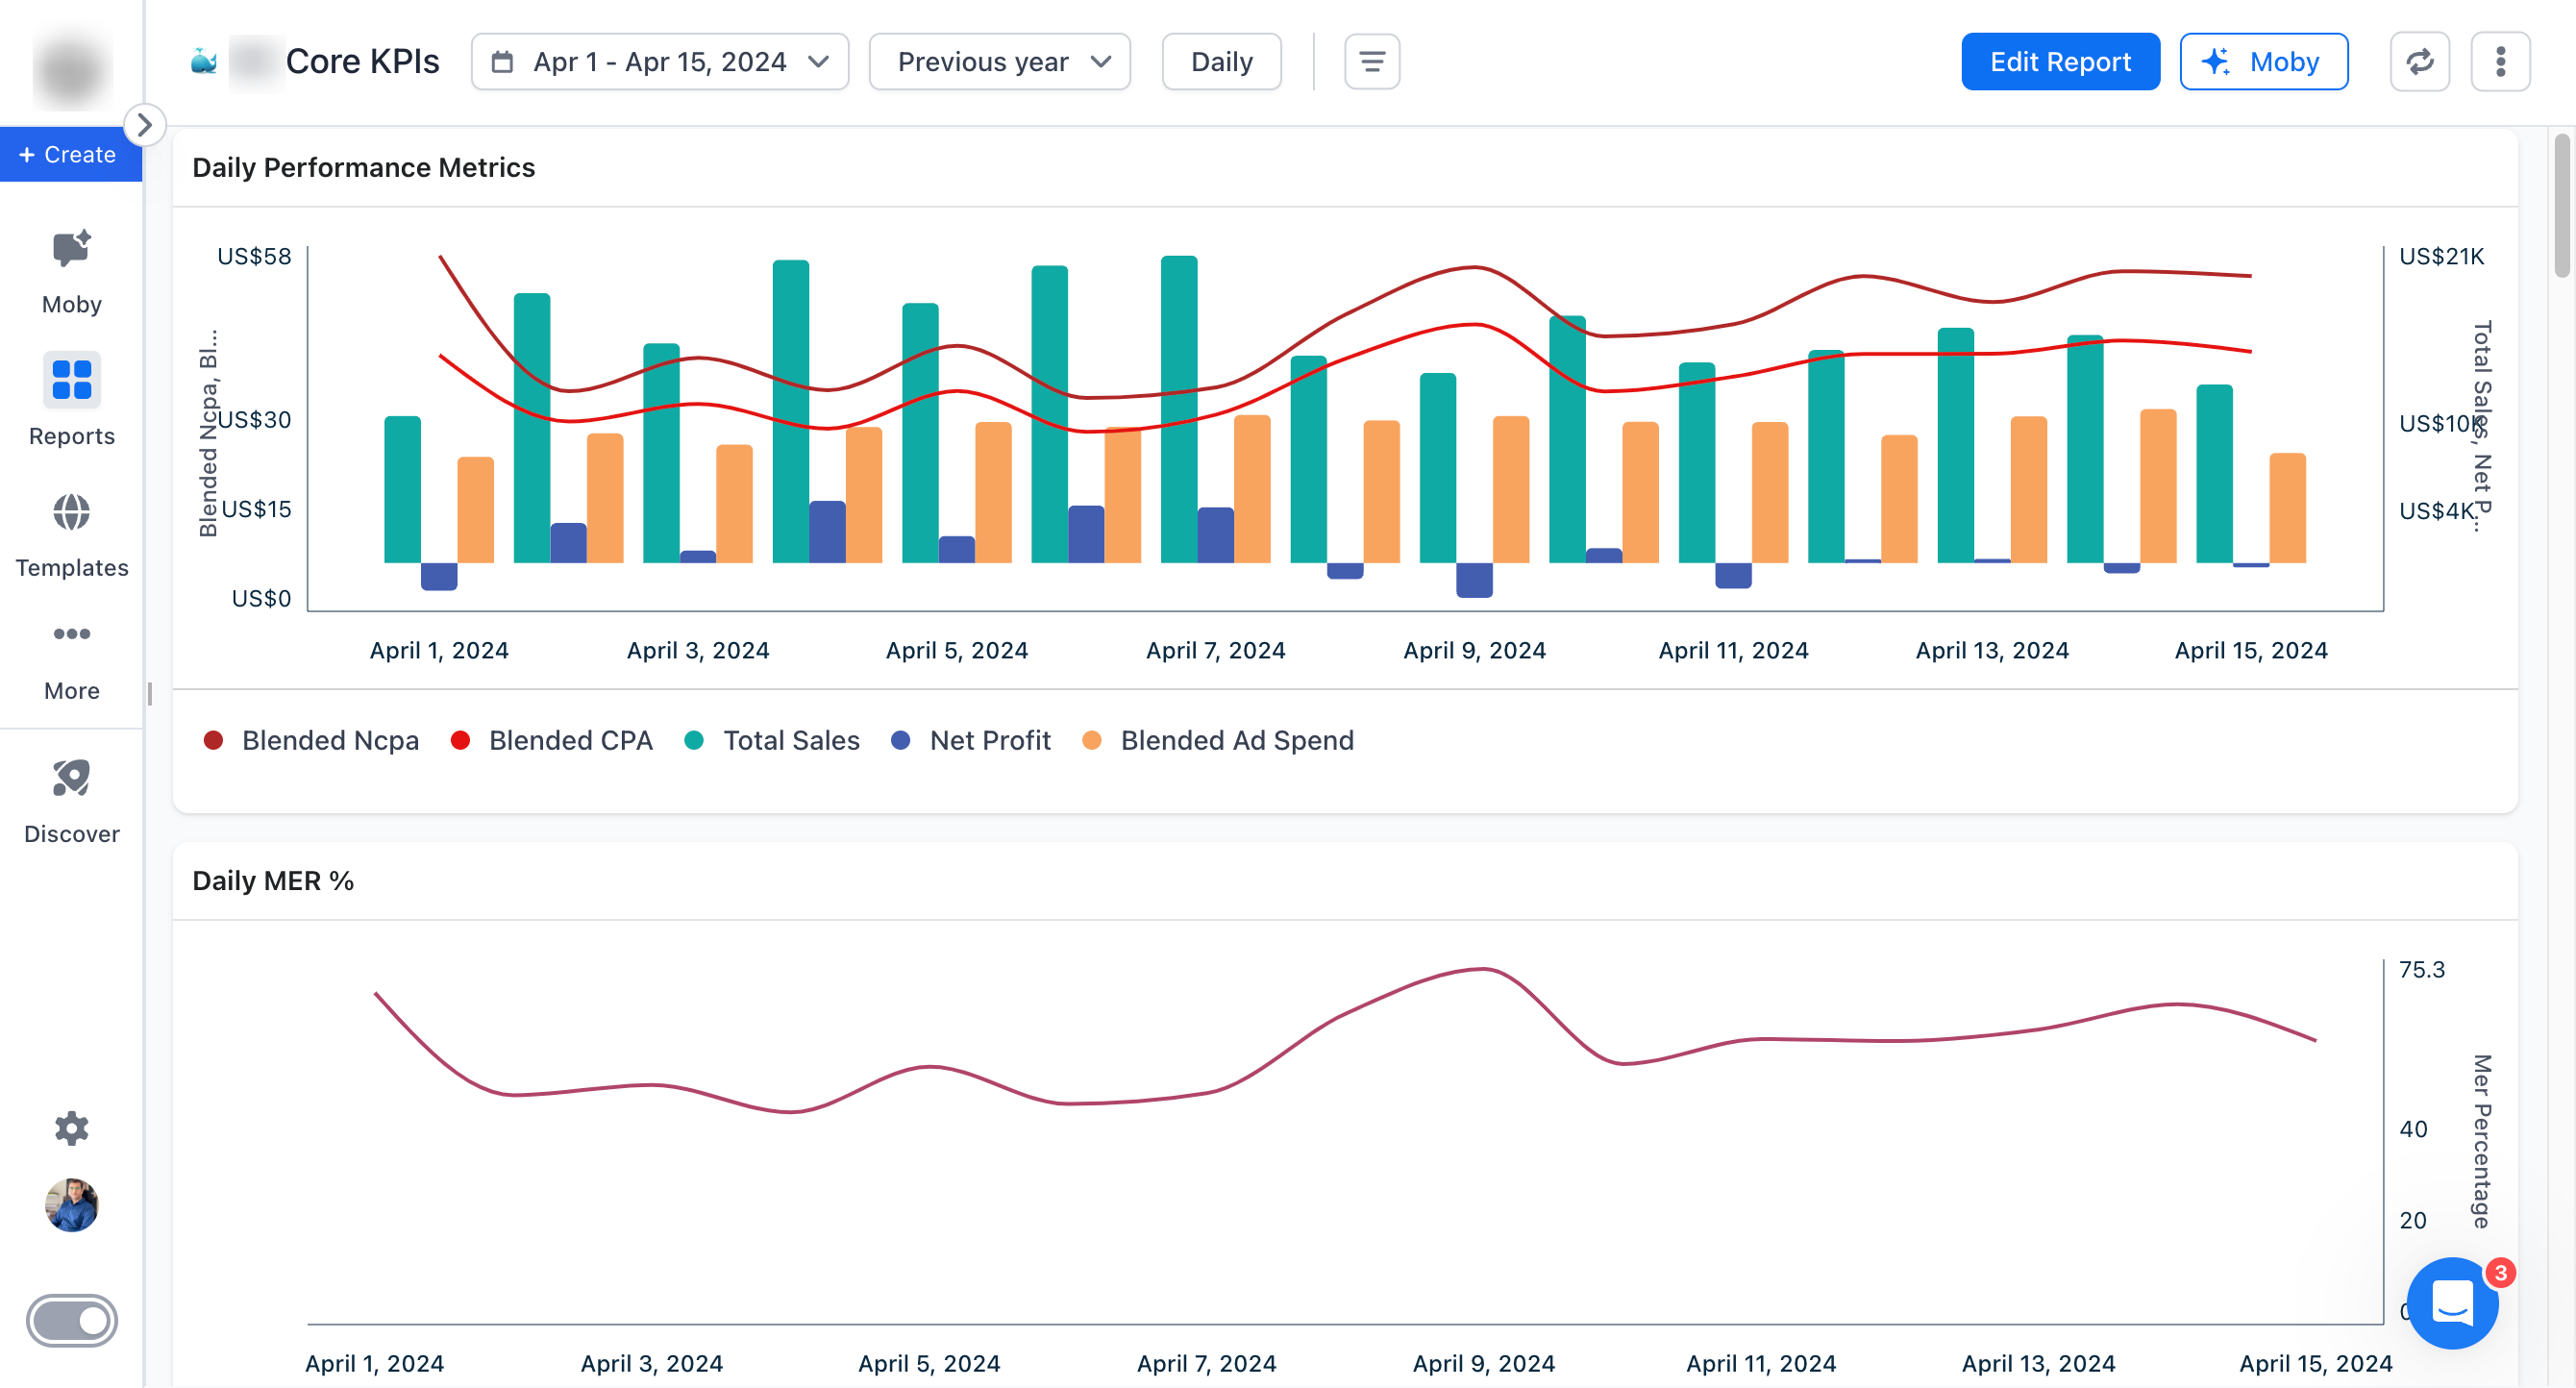
Visualization: Daily Core KPIs (Dynamic Dashboard)
This is what helps in day-to-day decision-making.
Start with:
Daily Performance Metrics
For this specific 7-figure brand, we used the following performance metrics:
Total Sales
Blended (Total) Ad Spend
Net Profit
Blended CPA
Blended NCPA
Some operators prefer to use Contribution Profit instead of Net Profit.
But as our OPEX/day was added to Triple Whale, we preferred Net Profit.
This is what it looks like over a longer period of time:
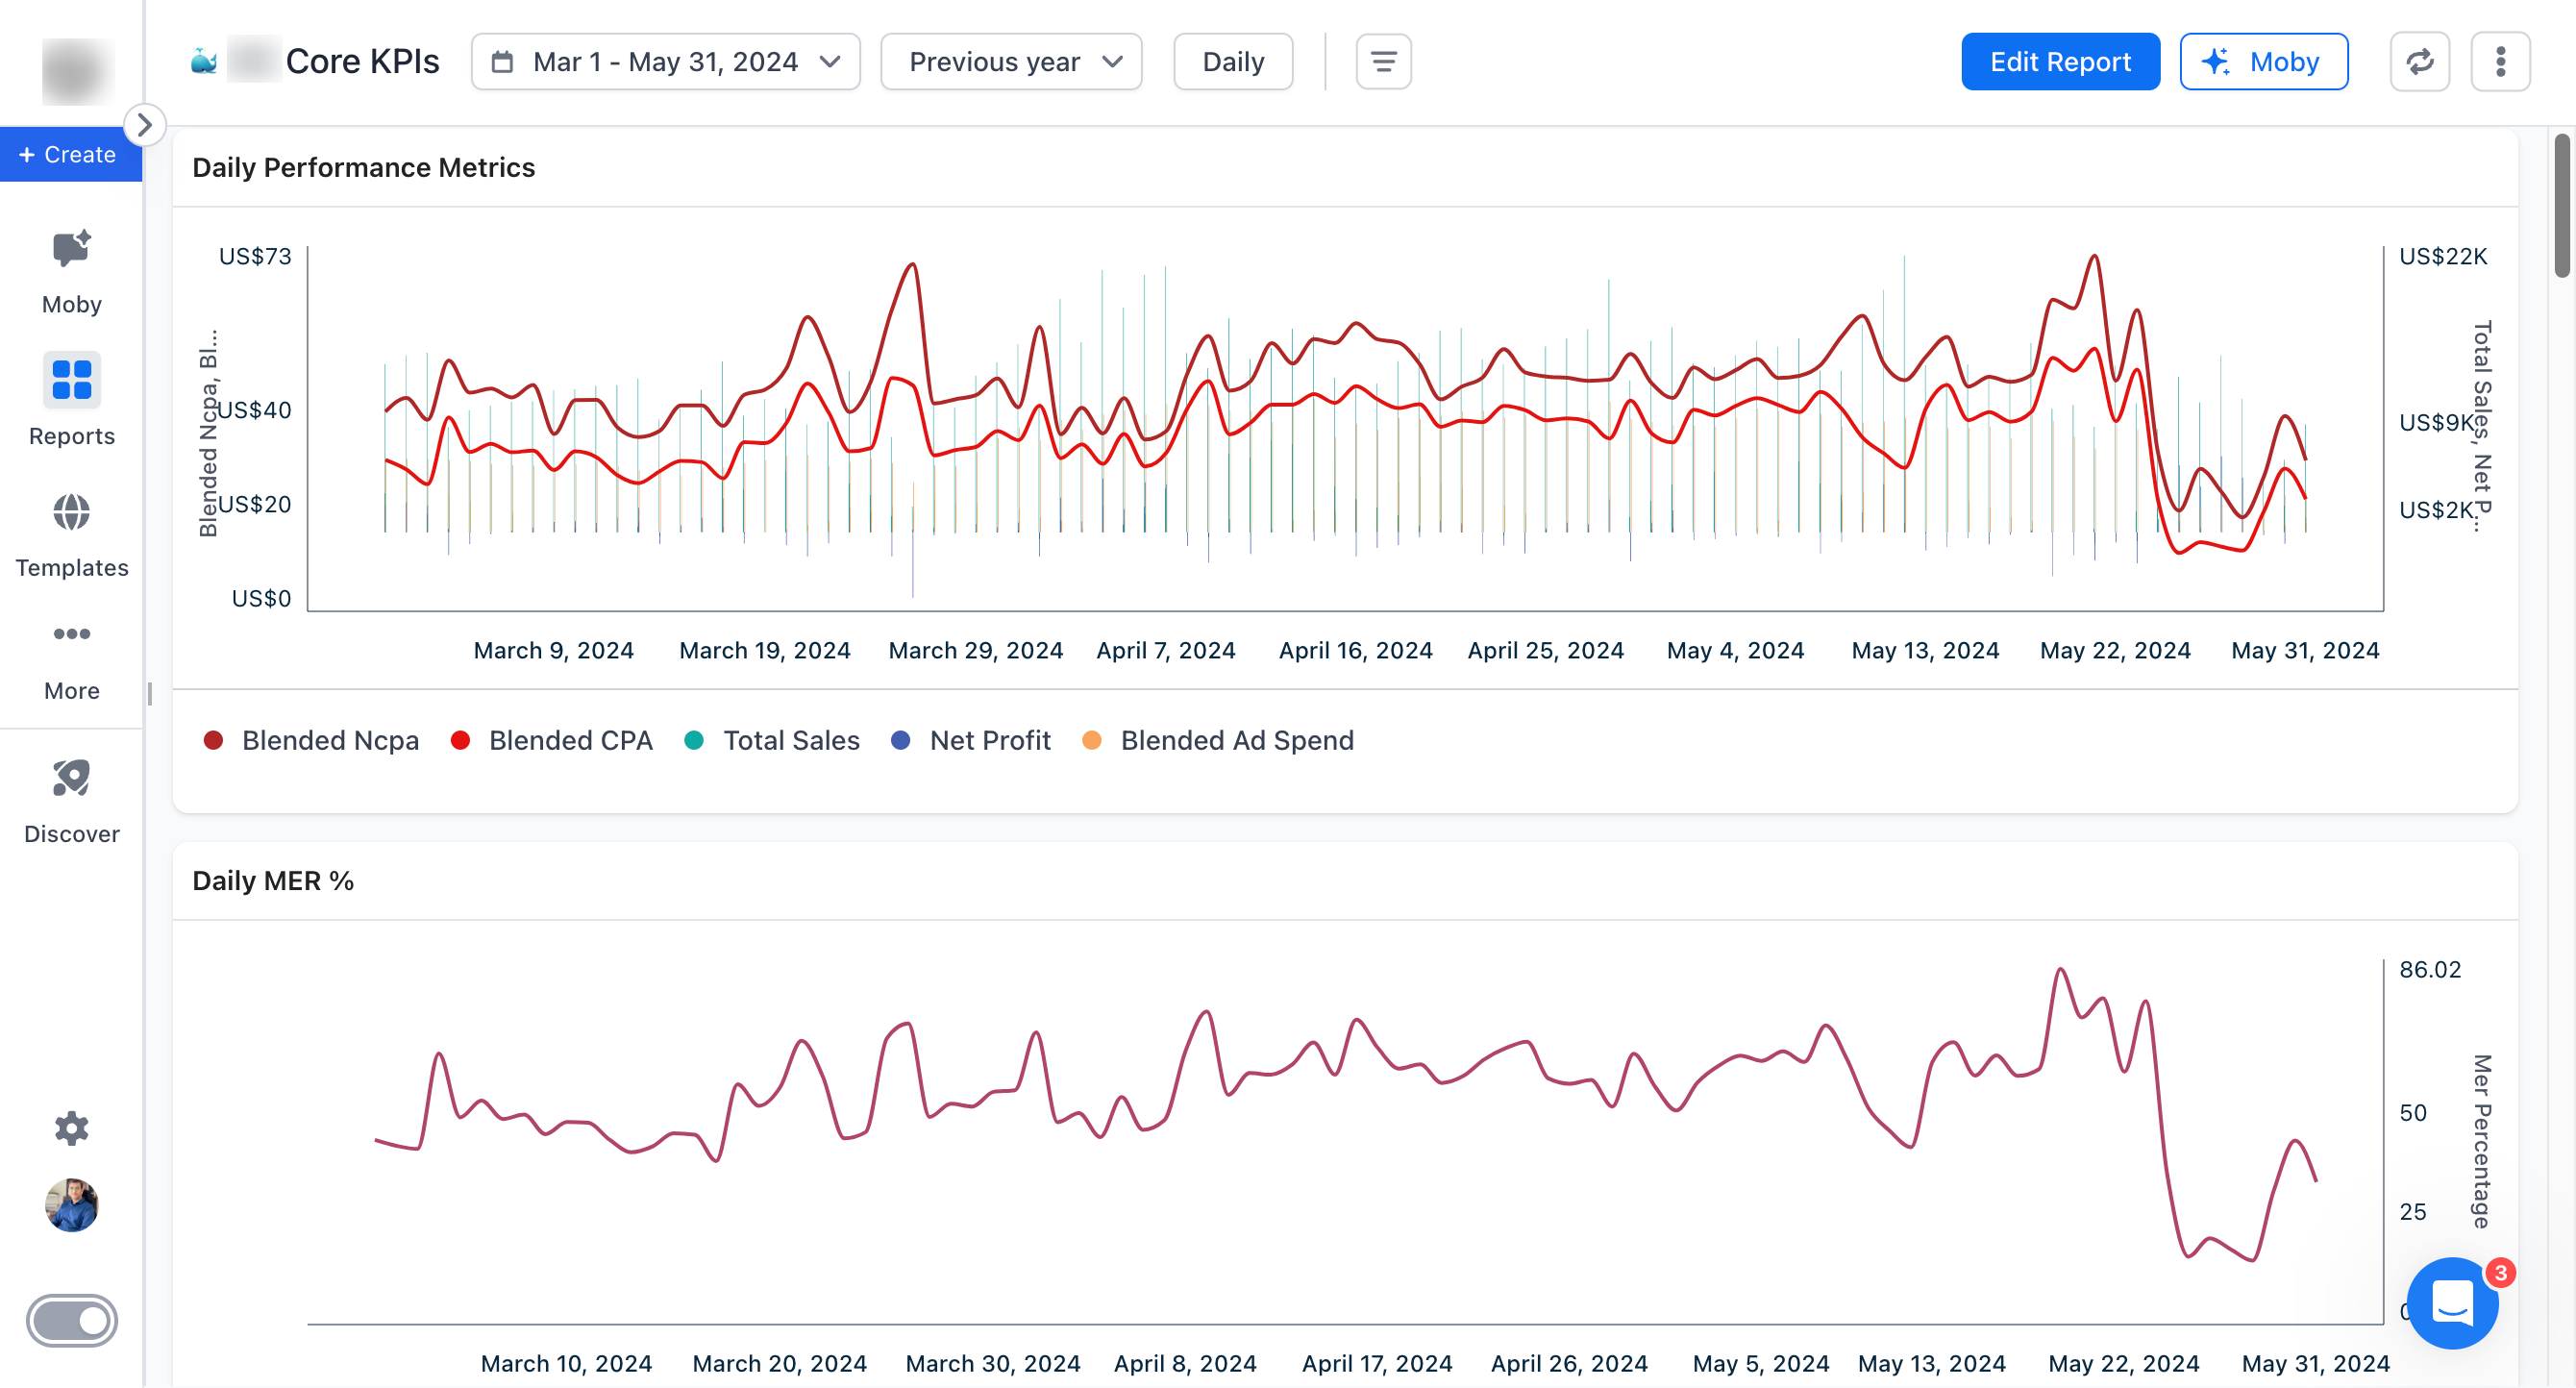
(As you can see, during the end of May, our blended CPA and nCPA went so rogue that we had to cut down ad spend totally and rebuild things from scratch.)
Next comes:
1 🔑 Metric (tied to OKRs)
For us, it was MER (Marketing Efficiency Ratio, i.e., % of revenue spent on advertising).
We picked it from our 2024 OKRs.
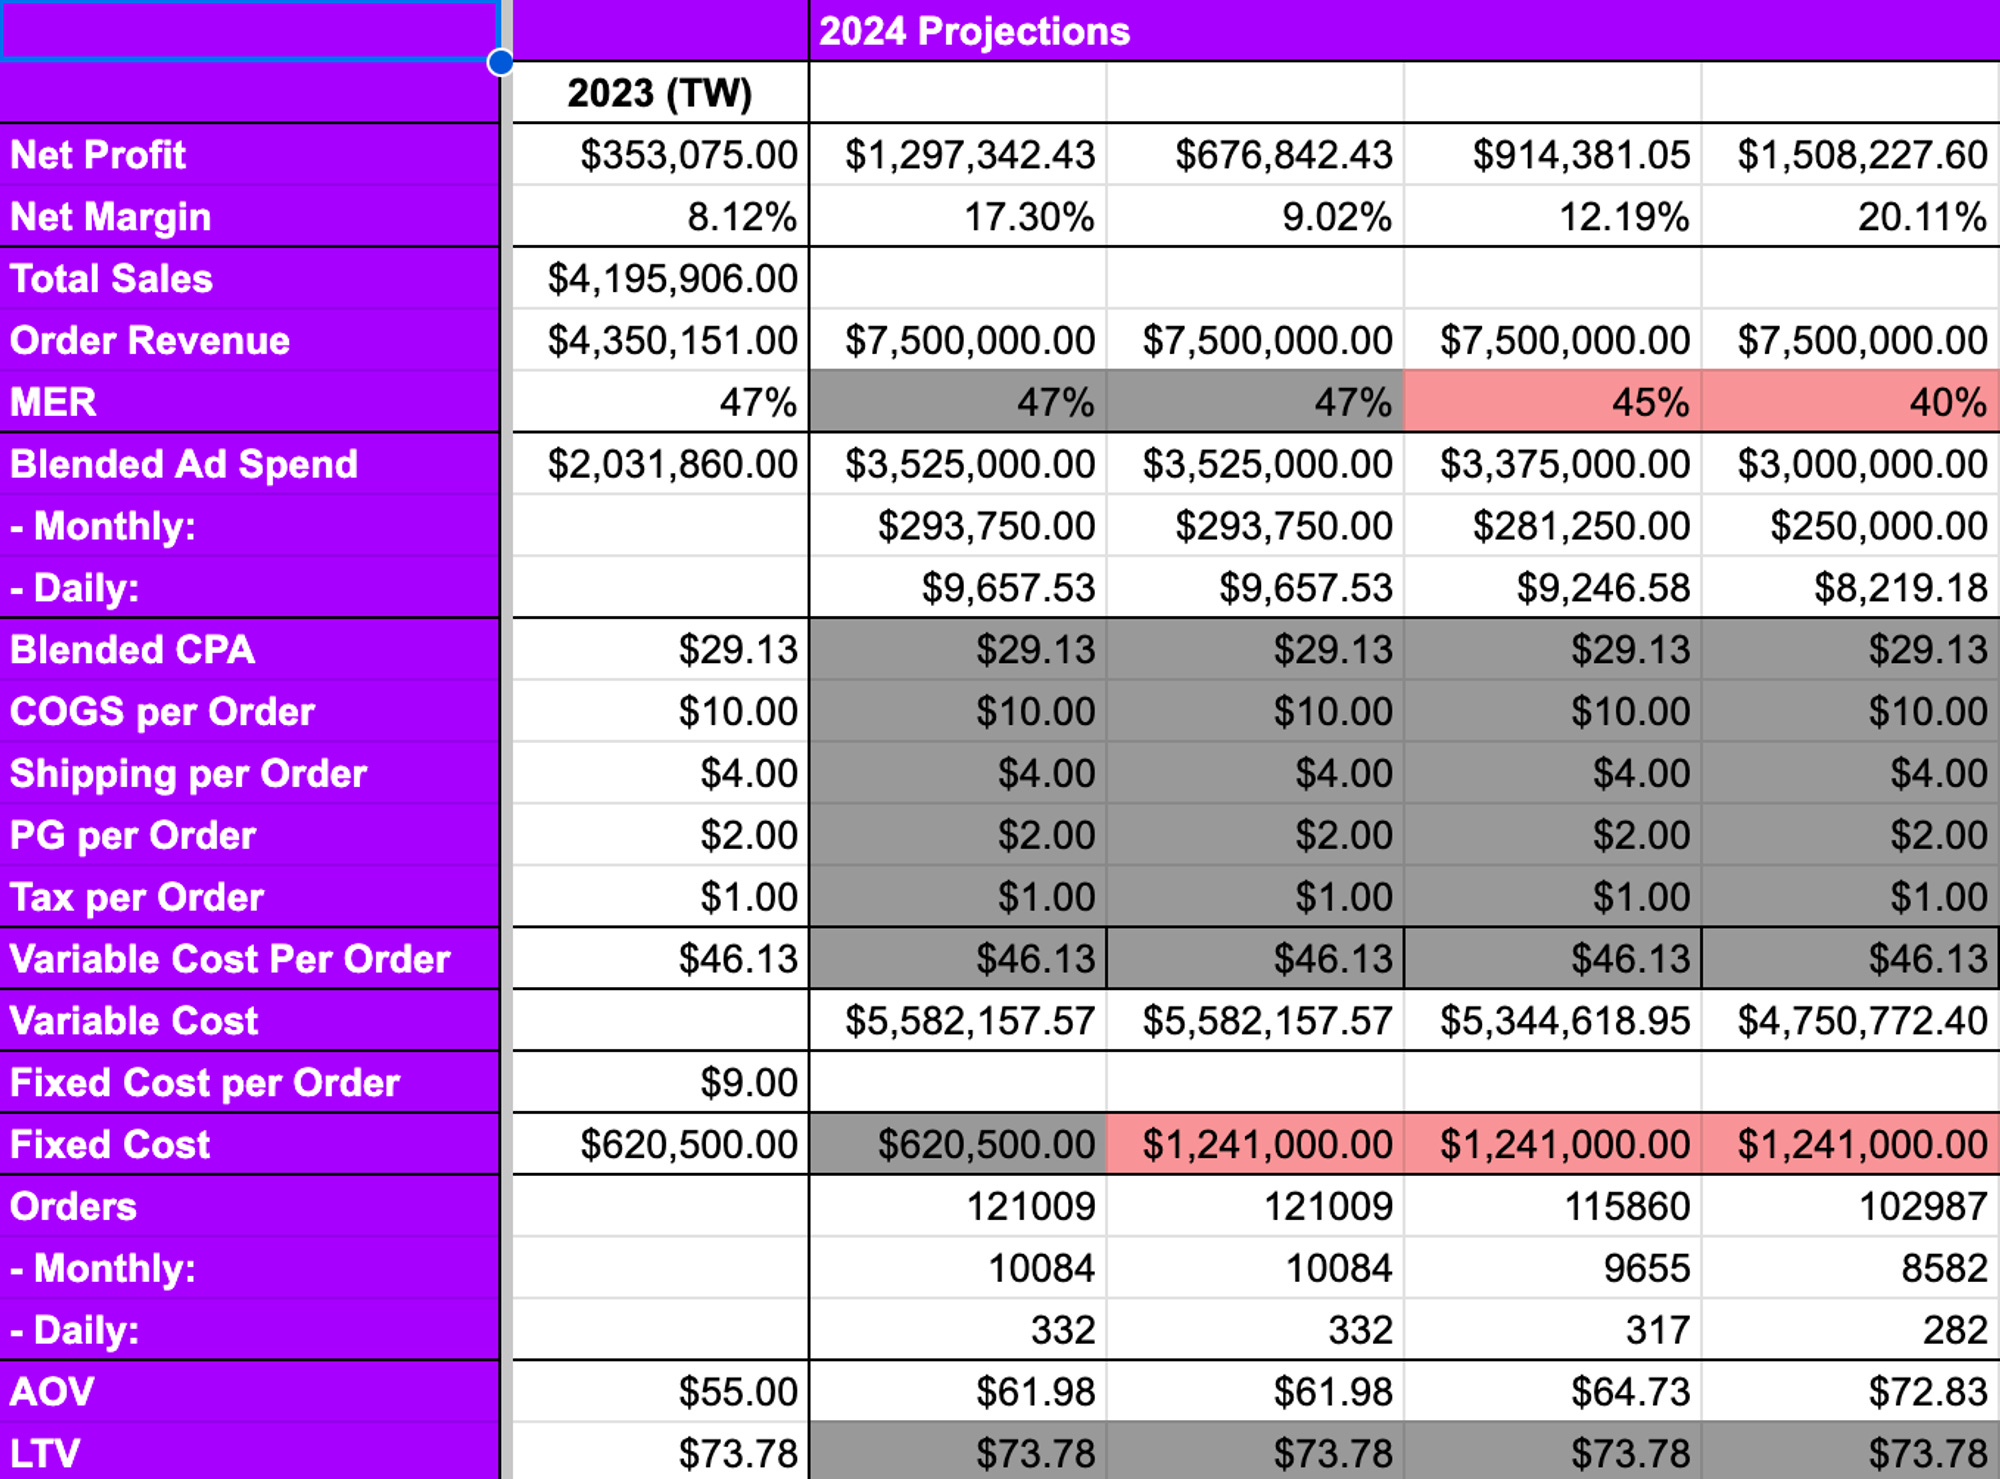
2024 OKRs for this brand:
Objective: Scaling Top Line Revenue with Healthy Bottom Line
Key Results:
Achieving $7.5M revenue in 2024 (vs $4.5M in 2023)
More Net Profit ($) than 2023 while scaling revenue
Reducing MER from 47% to 40%
Based on your OKRs, you might want to pick a completely different 🔑 Key Metric.
Other Metrics
Beyond the above 2 charts, we kept eyes on the daily charts of the following metrics:
aMER (Acquisitions Marketing Efficiency Ratio. aMER = New Customer Revenue / Total Spend)
Refund amount
Revenue breakdown by Sales Channels (Shopify Web, Shopify Shop, Facebook & Instagram Shop, Tiktok Shop, Amazon)
Conversion Rate, Checkout to Purchase %, Cart to Checkout %, Add to Cart %
AOV
Orders (New vs Returning)
Orders vs Returns
#1 Acquisition Channel (Meta Ads) in-platform KPIs (CPA, CPM)
Users, New Users, New Users %
Order Distribution by AOV Slabs
and more.
Now comes the most important recommendation:
Go & setup these 3 dashboards within the next 24 hours.
Then keep customising them to fit your brand and requirements better.
Build the habit of checking & interpreting these KPIs while making decisions.
Bonus: Chat with 🐳 Moby: Your AI Assistant (Probably your most important teammate)
Let me give you an example to show how valuable having data at our fingertips is.
We were vetting new Meta Ad agencies. We were interviewing them, checking their audits. We could challenge a lot of their recommendations based on our data.
One of those recommendations was:
“Change Meta Ads attribution settings from 7DC to 1DC.”
We asked Moby something like:
“What is the average duration between the first visit to our website to first purchase, for all new customers of 2024?”
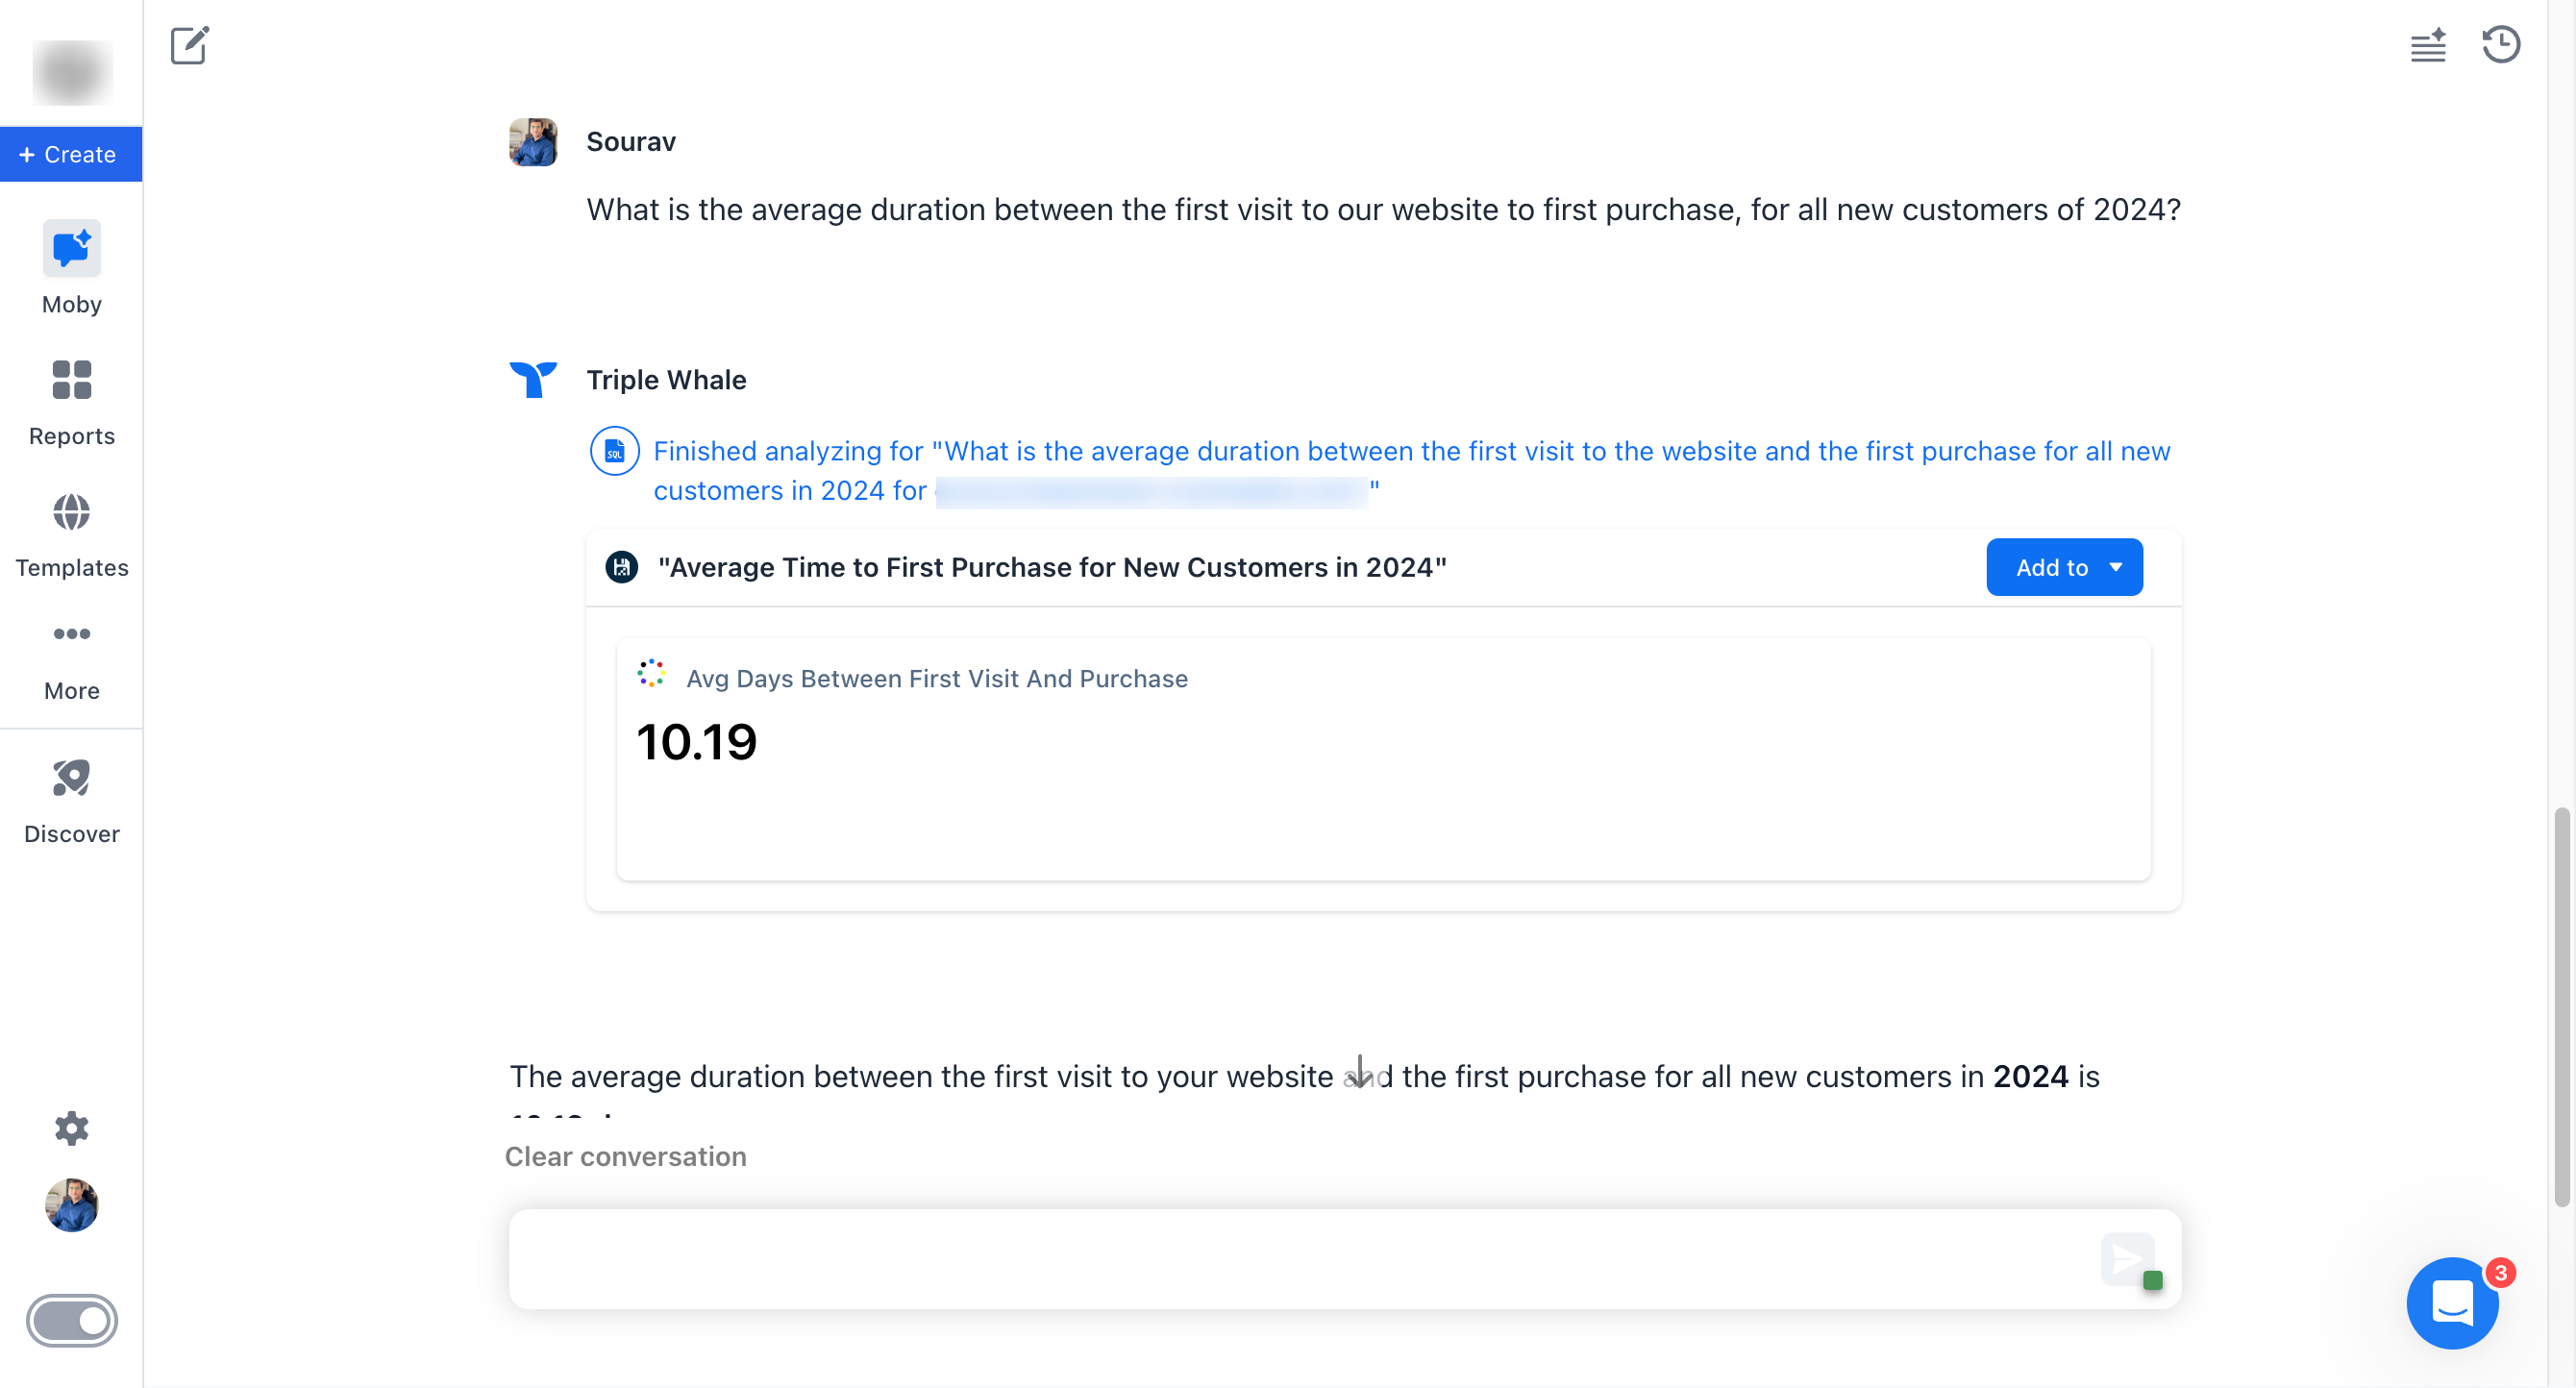
When the first visit to first purchase takes over 7 days, how does it make sense to optimise for 1 day click?
This is just an example. What you can do with it is only limited by your own imagination.
Triple Whale 3.0 Moby Prompt Library (Searchable Notion Database)
Wondering where to start? Here is a full library of prompts to play with.

I know how busy you are. And I appreciate you taking time to read this long post.
But I strongly believe it will help reduce your headaches while impacting your business better.
If you can build comfortability around data, you’ll be able to inspire data-first culture into your organisation.
That’ll drastically impact the decision making process in each and every area of your business.
Coming to full circle from where we started: DECISIONS, #1 obstacle in the path of your organisation’s true potential.
I sincerely hope that this post helps you take the first step towards, eliminating that obstacle.

Caution: It’s NOT the ‘1 Triple Whale Setup to Rule them All’

I just wanted to give you a starting point for setting up Triple Whale to get the ball rolling as soon as possible.
You’ll make it better over time, based on your requirements, opportunities, & challenges.
Also, I love the Triple Whale community and the DTC community (on X, especially), where we get to learn so much from each other.
If you have some feedback or suggestions to improve my setup, help others reading this, please leave a comment.