
eCommerce Finance Simplified to Help You Make More this year
The Profit Funnel Every eCommerce Founder Must Master

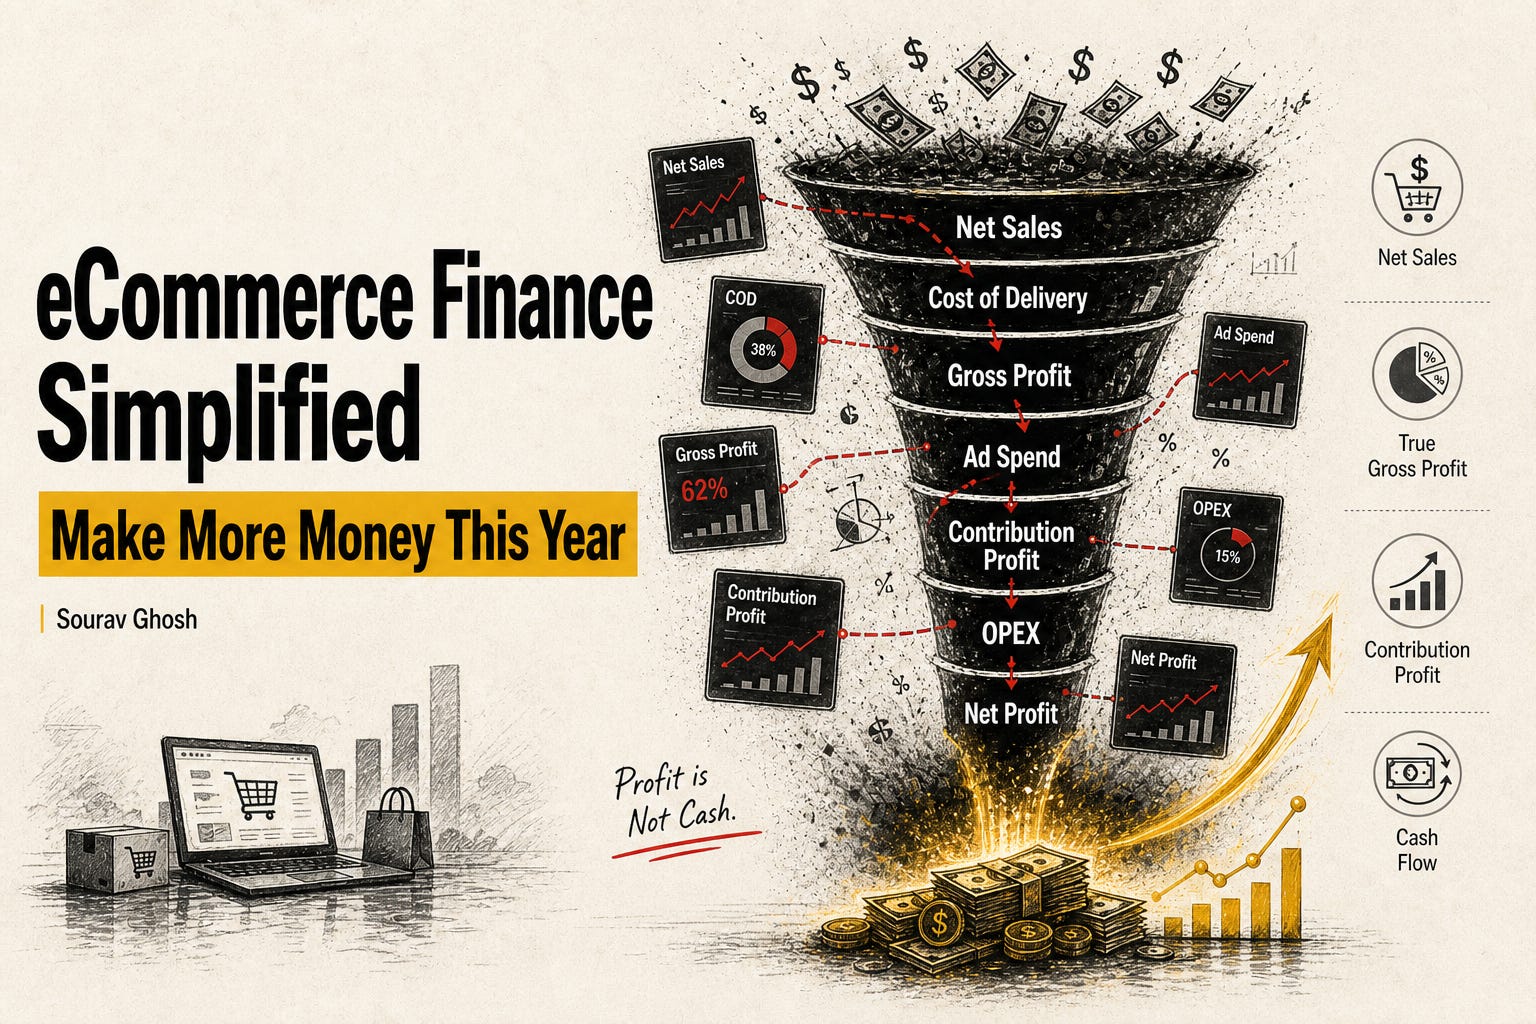
eCommerce owners with better mastery over their finances have significantly higher net margins, more money in the bank, faster income growth, and pull capital out of their businesses at higher rates. (According to The 2026 eCom Trends Report by ECOM FUEL).
Is that compelling enough to convince you to invest the time to build an exceptionally strong financial foundation? Wouldn’t you like to put significant cash into your pocket?
In my work over the last decade, leading marketing and growth for eCommerce brands and mentoring founders and CEOs, I have learned the hard way that without this financial foundation, everything else eventually falls apart. I shared more about that experience in a 2024 Finaloop article.
In the last few years, I have worked with hundreds of eCommerce owners at different stages, sought to understand their struggles with finances, and helped them grasp the basics in the simplest possible way.
If you are still intimidated by all the numbers, let me simplify the foundation for you.
eCommerce profit funnel
Unless you understand this funnel well enough to monitor where every dollar from your sales goes and what is left as profit, it’s nearly impossible for you to lead your brand’s growth.
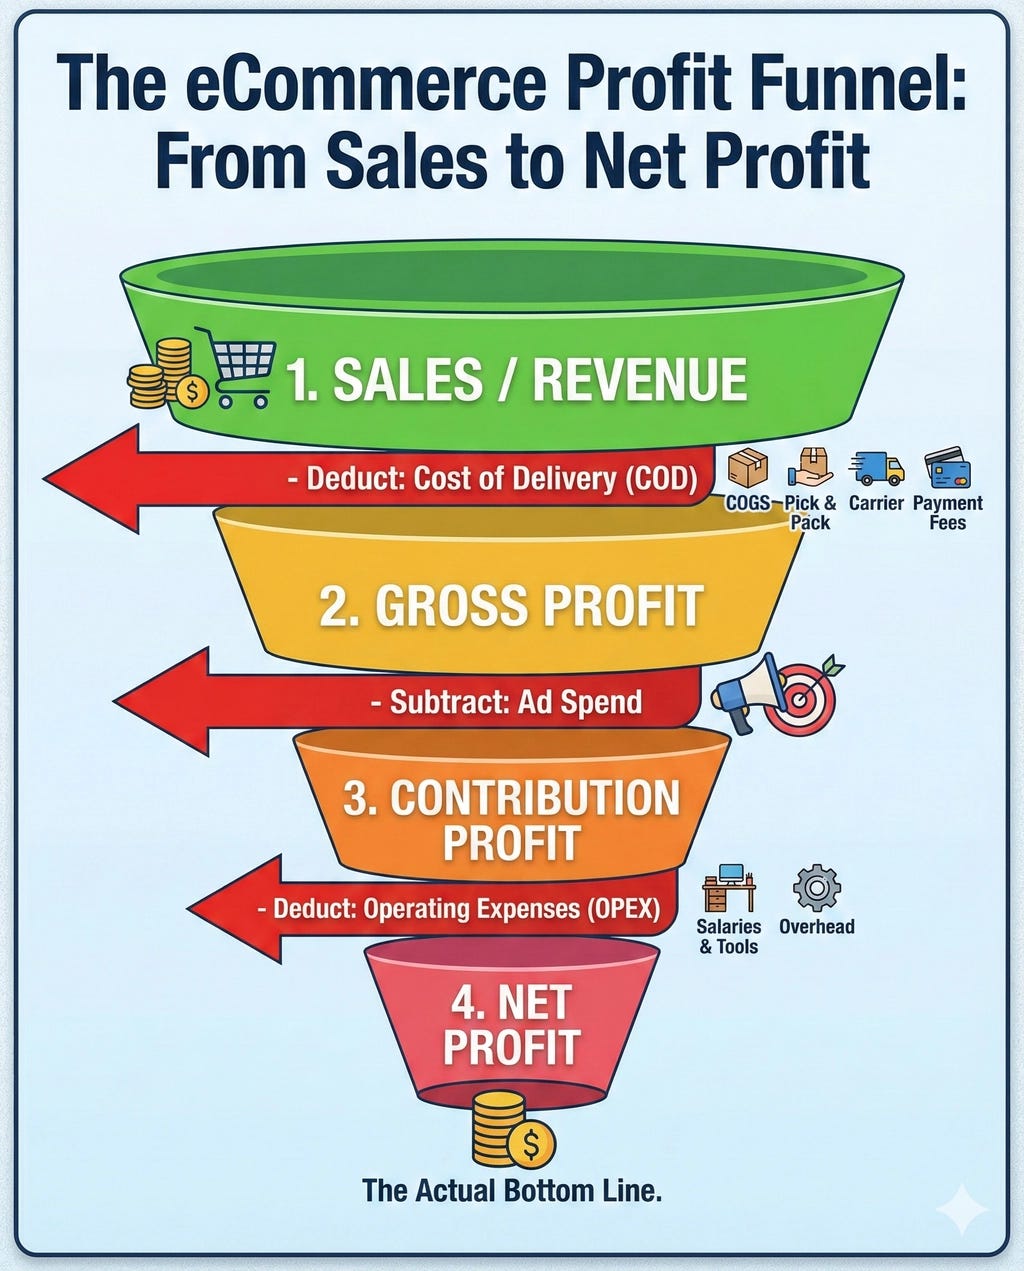
Now, let’s try to understand each of the components.
Understand different Sales/Revenue metrics:
I wish there were a universally accepted definition of sales and revenue that all eCommerce platforms, analytics platforms, and accounting platforms would use. Unfortunately, that is not the case.
E.g., see different sales and revenue-related metrics used by Shopify and Wix platforms.
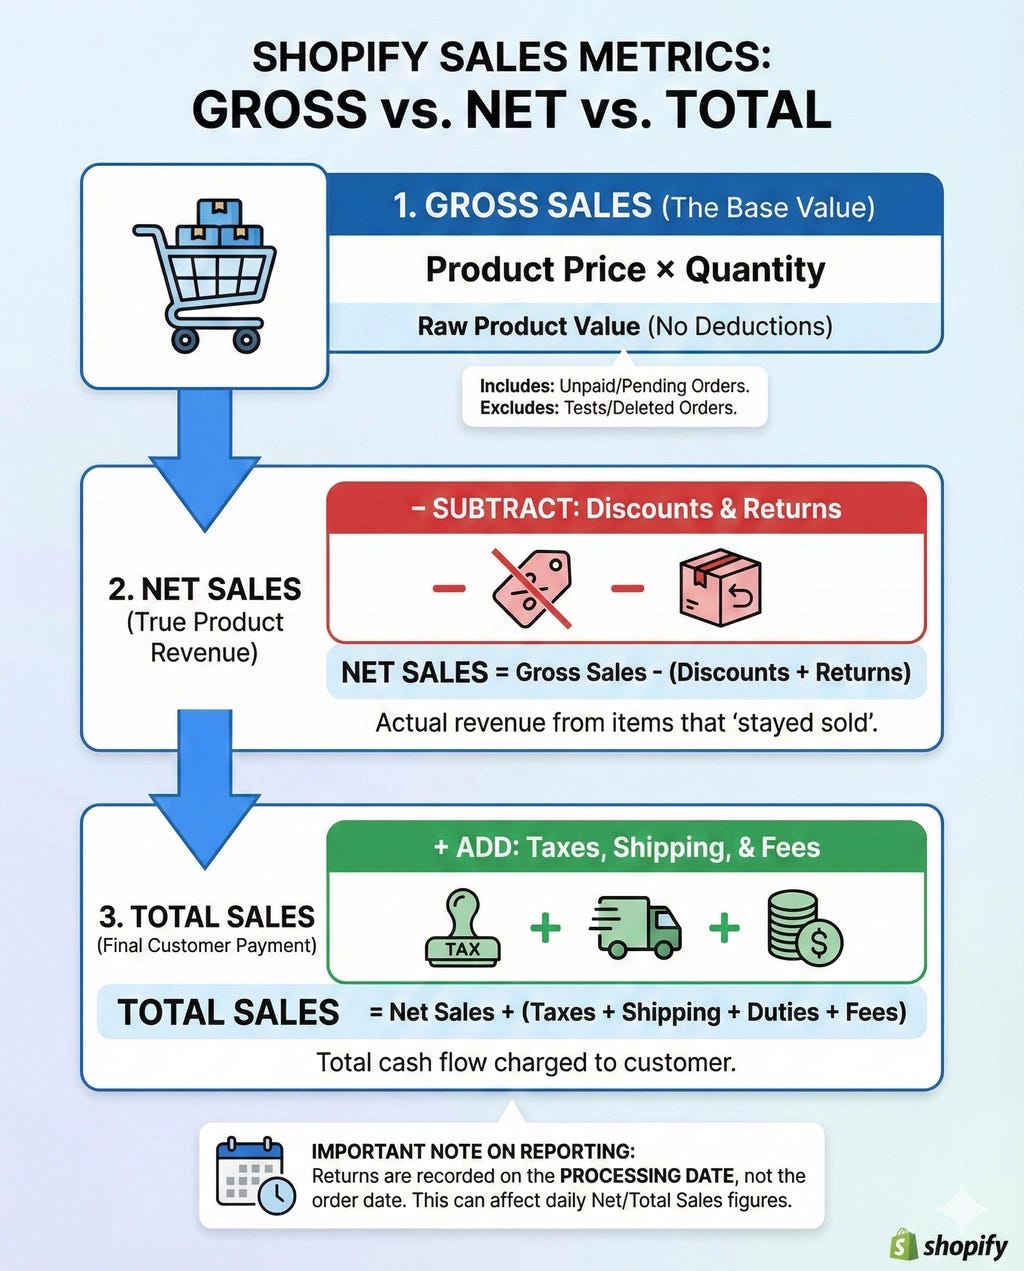
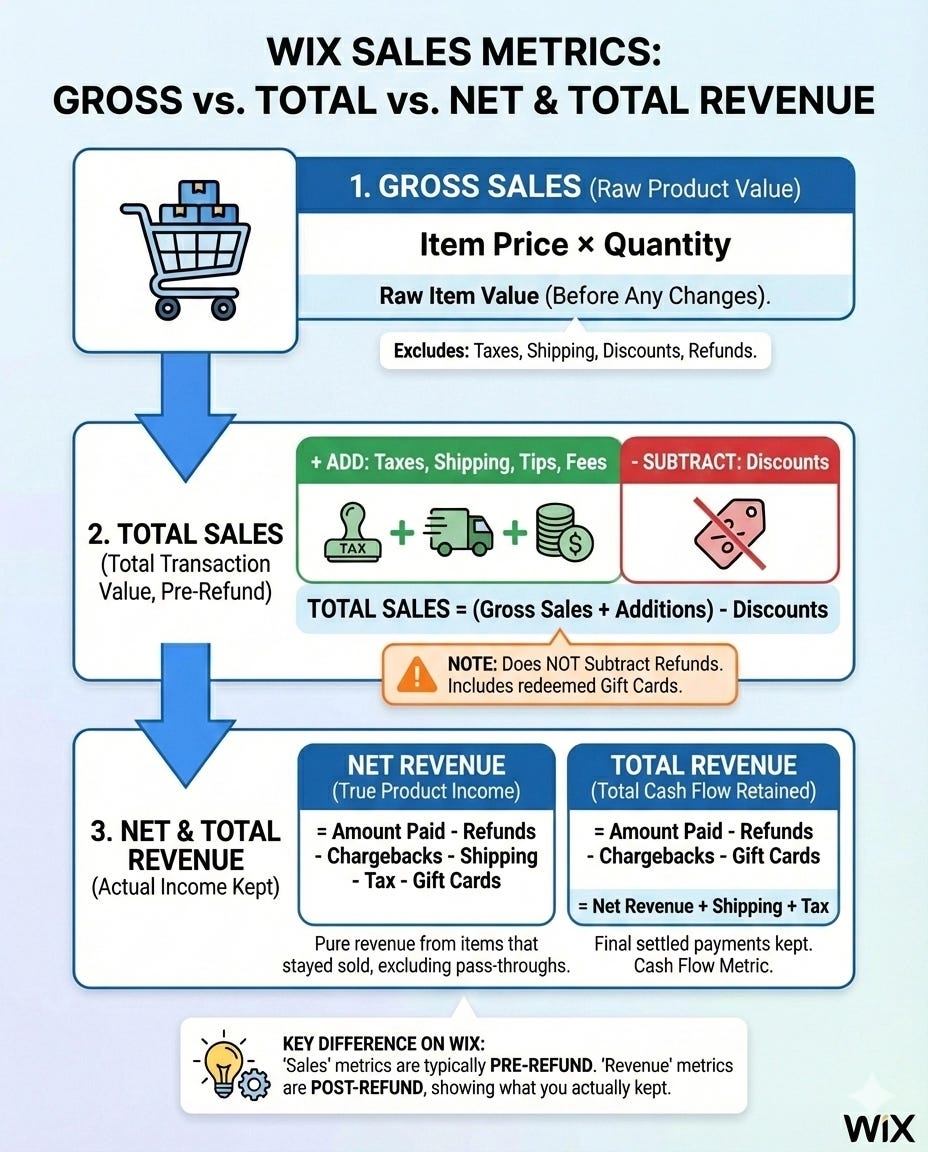
When you are monitoring your eCommerce profit funnel, make sure you start with the right metric or right definition. For example, for Shopify brands generally, we start with net sales.
Net Sales = True product revenue after deducting discounts and returns.
Understand Cost of Delivery (COD) - think beyond Cost of Goods Sold (COGS)
If you are only considering COGS as the product cost, then you are overestimating your ability to spend on marketing and operational expenses.
Your accountant might file a lot of these much later in your P&L under operational expenses, but that will be misleading for growth and marketing purposes, because these are variable expenses similar to COGS, not fixed costs that should sit within operational expenses.
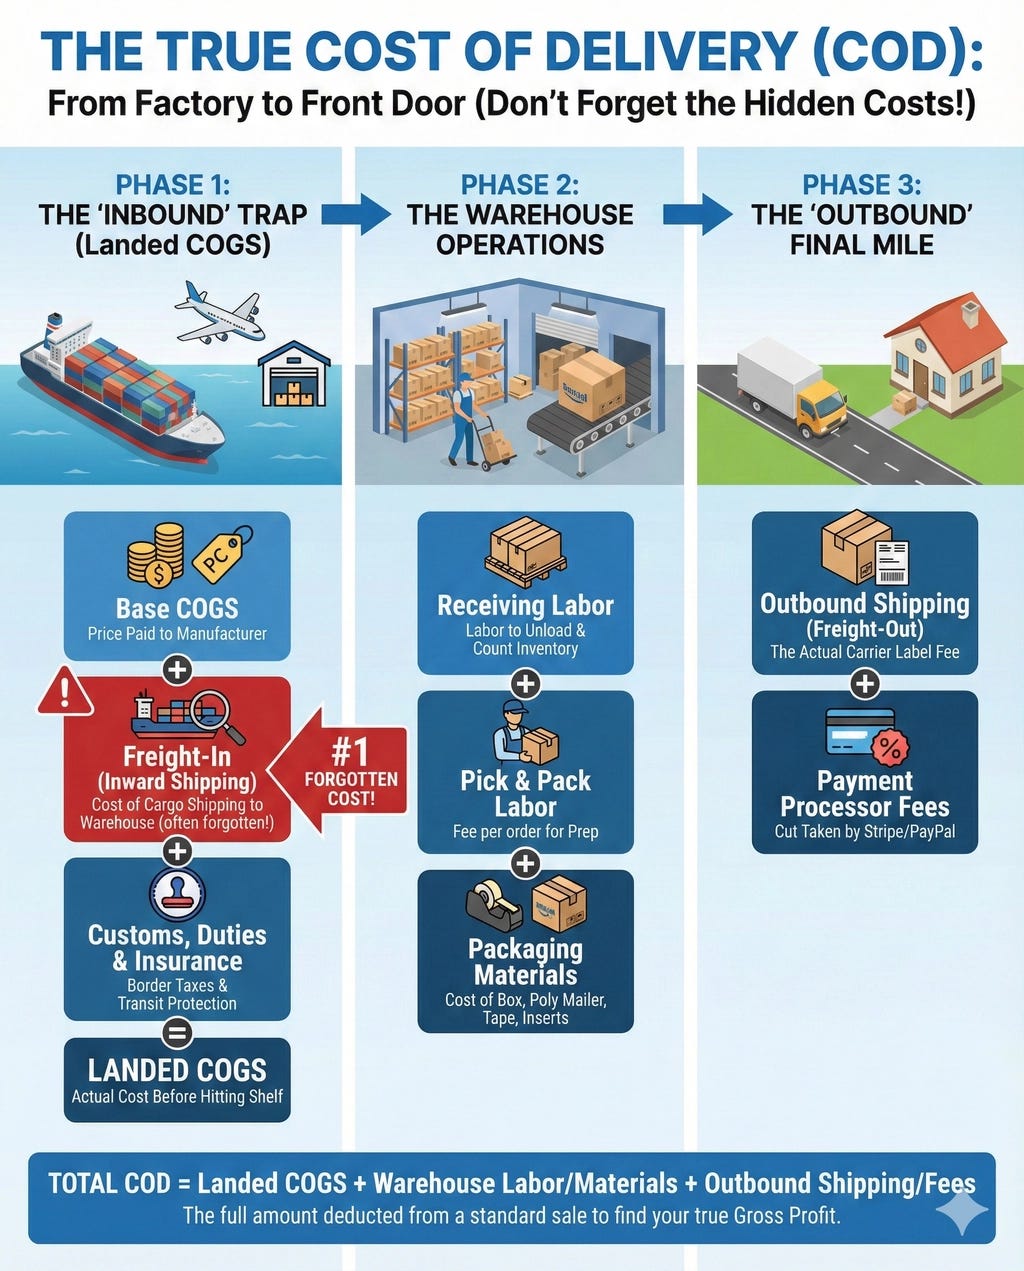
The total cost of delivery is the cost of moving your product from the manufacturer to the fulfillment center, and then delivering it to the customer.
A lot of eCommerce brands incorrectly calculate this, especially because they get some of the invoices (like shipping costs) later from their 3PL or logistics partners.
But you can’t afford to do that, either. You have to take that cost into account from your agreed rate or use an estimated rate based on your previous invoices.
Unless you get your cost of delivery right, it’s going to mess up your gross profit calculation, which is the foundation of your e‑commerce growth strategy.
(True) Gross Profit
I’ve seen horror stories of brands growing fast on the assumption of a 70% gross margin, only to realize they were underestimating costs by counting only COGS, not the total cost of delivery. A corrected calculation can shrink their gross margin to 50% or less, bringing the harsh realization that the money spent on ads was money they couldn’t afford to spend to fund growth at a loss.
They didn’t have favorable unit economics to grow in the first place.
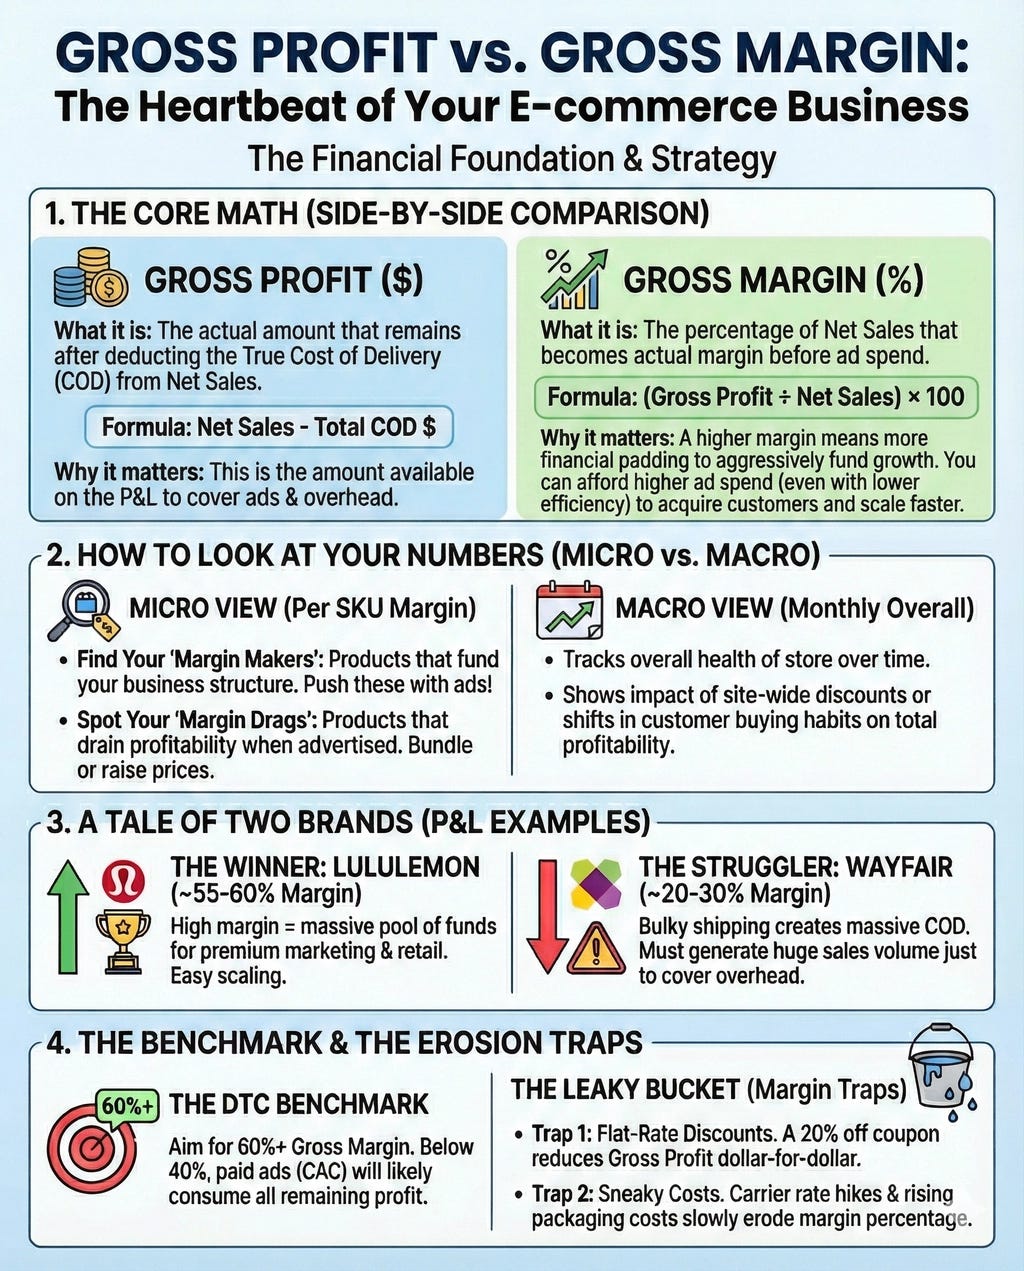
“Then look hard at your P&L — the stores winning at paid are running ~64% gross margins and ~15% overhead. If you’re not in that ballpark, the fix isn’t a better ad strategy. It’s a structural one.” ~ eCom Fuel 2026 trend report
Starting with a terrible gross margin is one of the examples of picking the wrong game that you can’t win.
Most eCommerce Founders Pick the Wrong Game

Many ecommerce brands I met over the last decade were desperately trying to solve problems with their Meta Ads, website, CRO, and so on.
That’s why I make it clear that a gross margin of 60% or higher is a non-negotiable growth-readiness requirement for any brand under seven figures to follow my blueprint to reach seven figures.
eCommerce brand with solid products, loyal customers stuck under $90K/m?

You built something real. Sales are coming in - maybe $15K last month, $20K the month before. You have a product people actually want, a Shopify store that functions, ads running, and content going out. By any reasonable measure, you are executing.
Tell me in the comments if you have the following two tables ready with you right now.
Per SKU Gross Margin Table
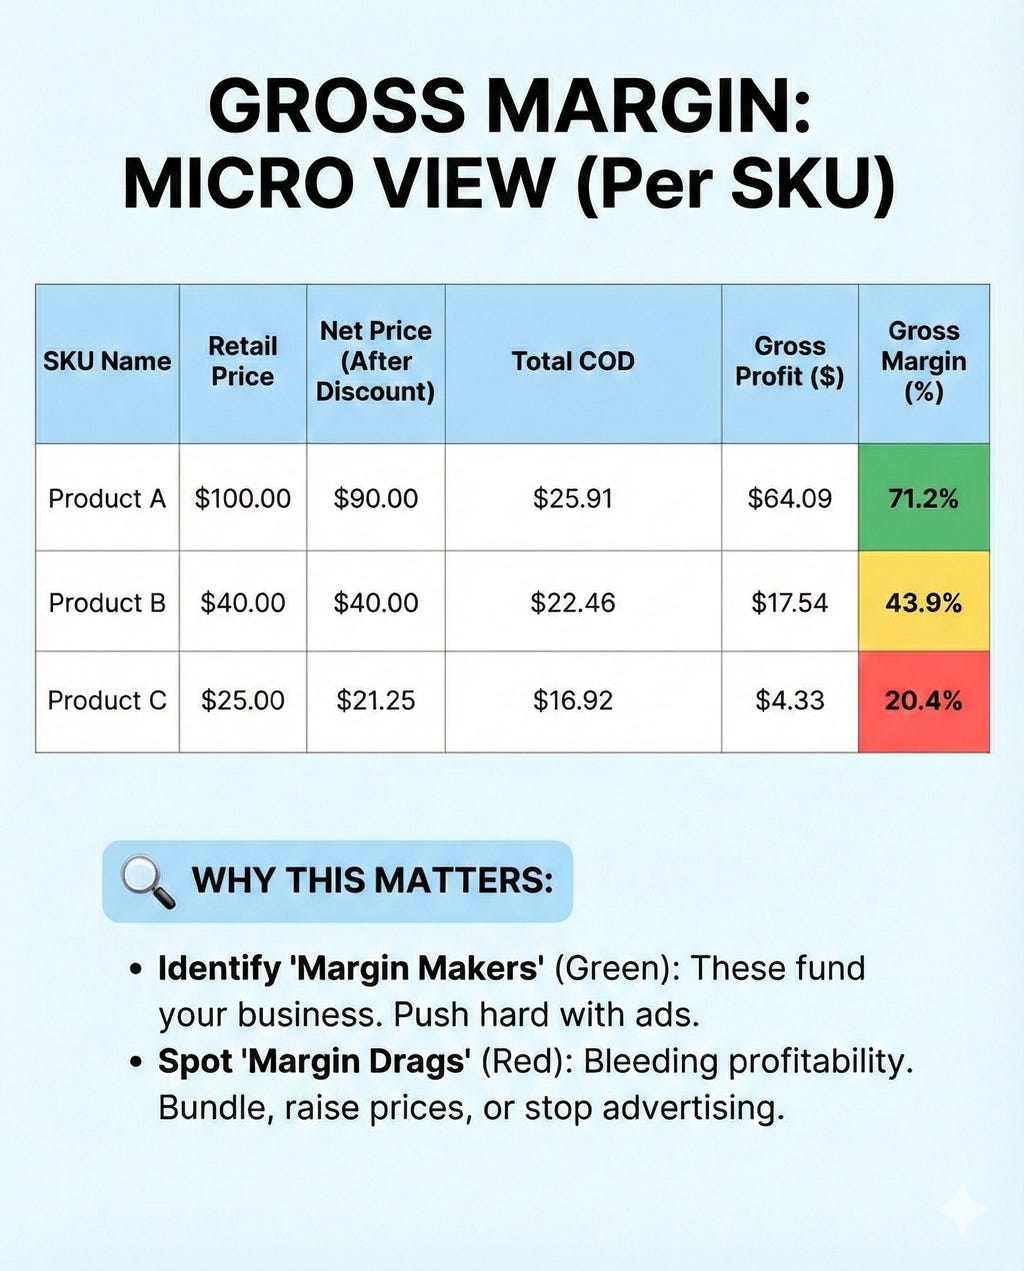
Impact on advertising strategy.
Gross profit per SKU = Max CAC ( Customer Acquisition Cost) for breaking even.
It’s another common mistake I’ve spotted in audits again and again: brands treating all their SKUs the same in advertising.
For smaller brands with the simplest structure, you only advertise the products with the highest gross margins because that’s the only way you can afford to spend significant money on acquisition and attract customers profitably, at scale.
The rest of your product line gets sold to first‑time or returning customers as upsells and cross‑sales through other channels. You can’t afford to spend money to market those products on their own.
For bigger brands with a more complex structure, you run separate manual bid campaigns with separate cost controls for different products with different margin profiles.
Planning strategic discounting.
This table tells you: can you actually afford to offer a discount?
You can add new columns to the above table or create a separate table to run new gross profit and margin numbers based on your discounted price.
Monthly Gross Profit & Margin
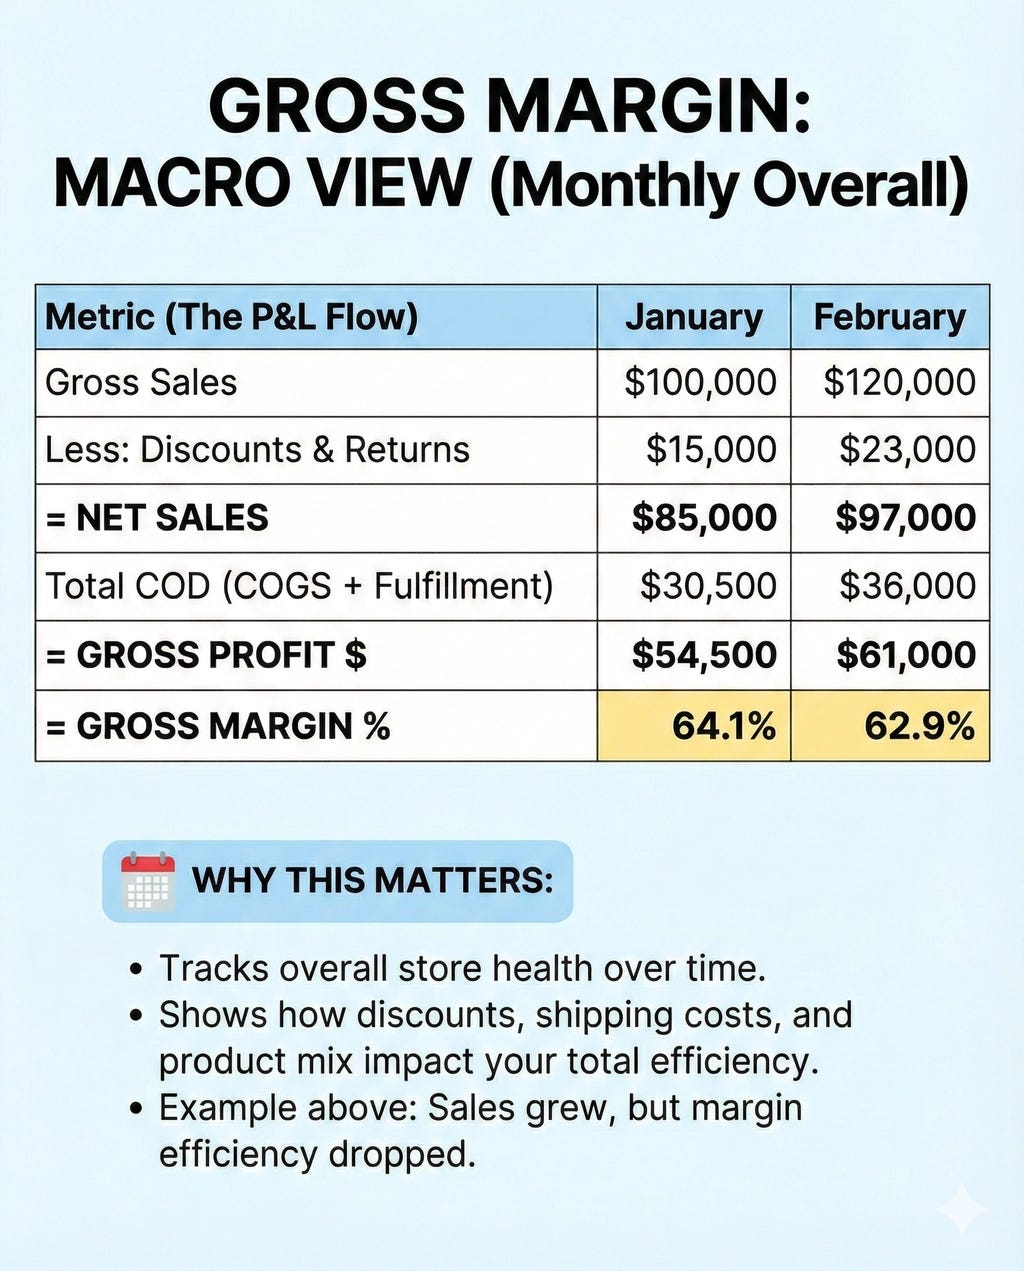
Ideally, as you scale, your gross profit should increase and your gross margin should vary very little. It should actually improve over time as you secure better supplier terms or achieve economies of scale by running your own manufacturing.
But sometimes external factors like tariffs can have a huge negative impact on your gross margin unless you have increased your price proportionately.
Ad Spend - MER - Blended ROAS
As the e‑commerce founder, if you haven’t stopped trusting platform‑reported ROAS numbers yet, do it today.
A slightly better measurement of advertising efficiency or return from advertising effort is MER or blended ROAS. Where you take into account the actual net sales from your e‑commerce platform and the total ad spend, not the platform‑attributed numbers.
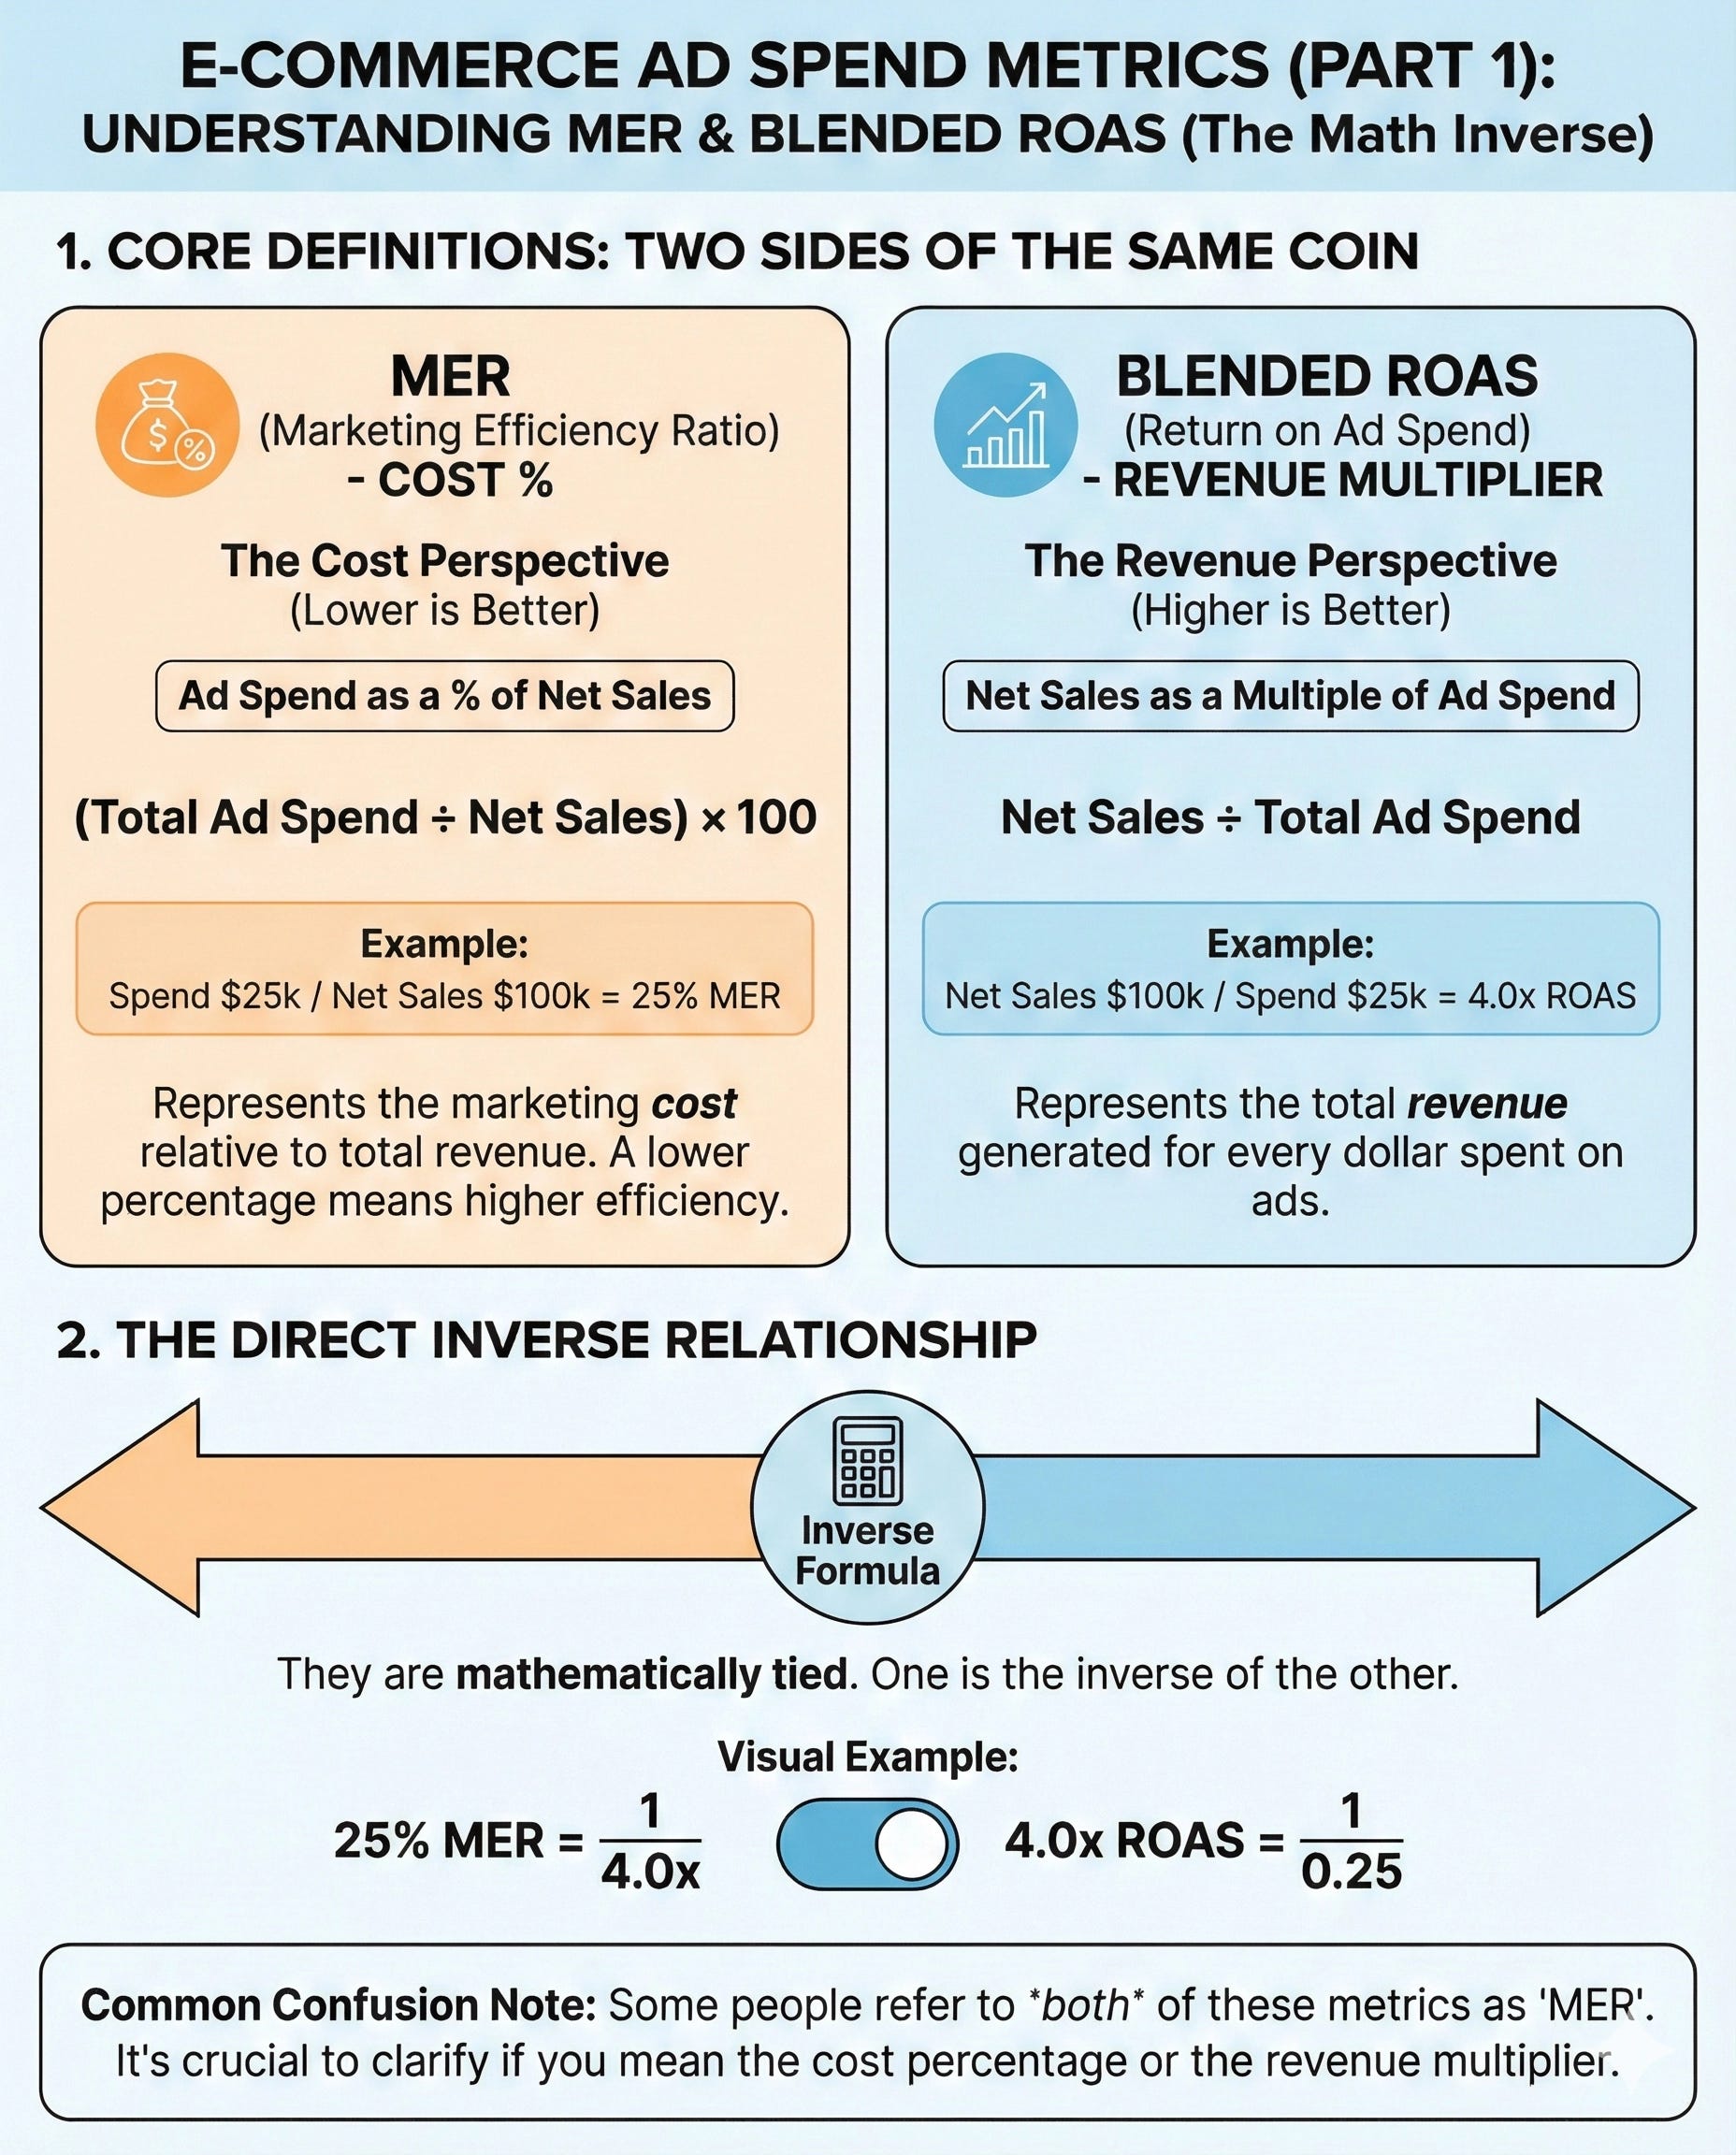
Consumable brands that clearly distinguish between new-customer and returning-customer business prefer metrics such as aMER (Acquisition MER) or NC-ROAS (New Customer ROAS), calculated from net sales of new-customer revenue only.
But I strongly recommend that you don’t prioritize these MER or ROAS numbers over your revenue and profit numbers.
I will write a dedicated, detailed post on why these efficiency metrics can be extremely misleading if your true north isn’t the top line and the bottom line.
I would recommend that you rather obsess about:
Contribution Profit
Obsess over tracking and generating more contribution profit daily, weekly, monthly, and yearly.
Contribution profit = Gross profit - Ad spend.
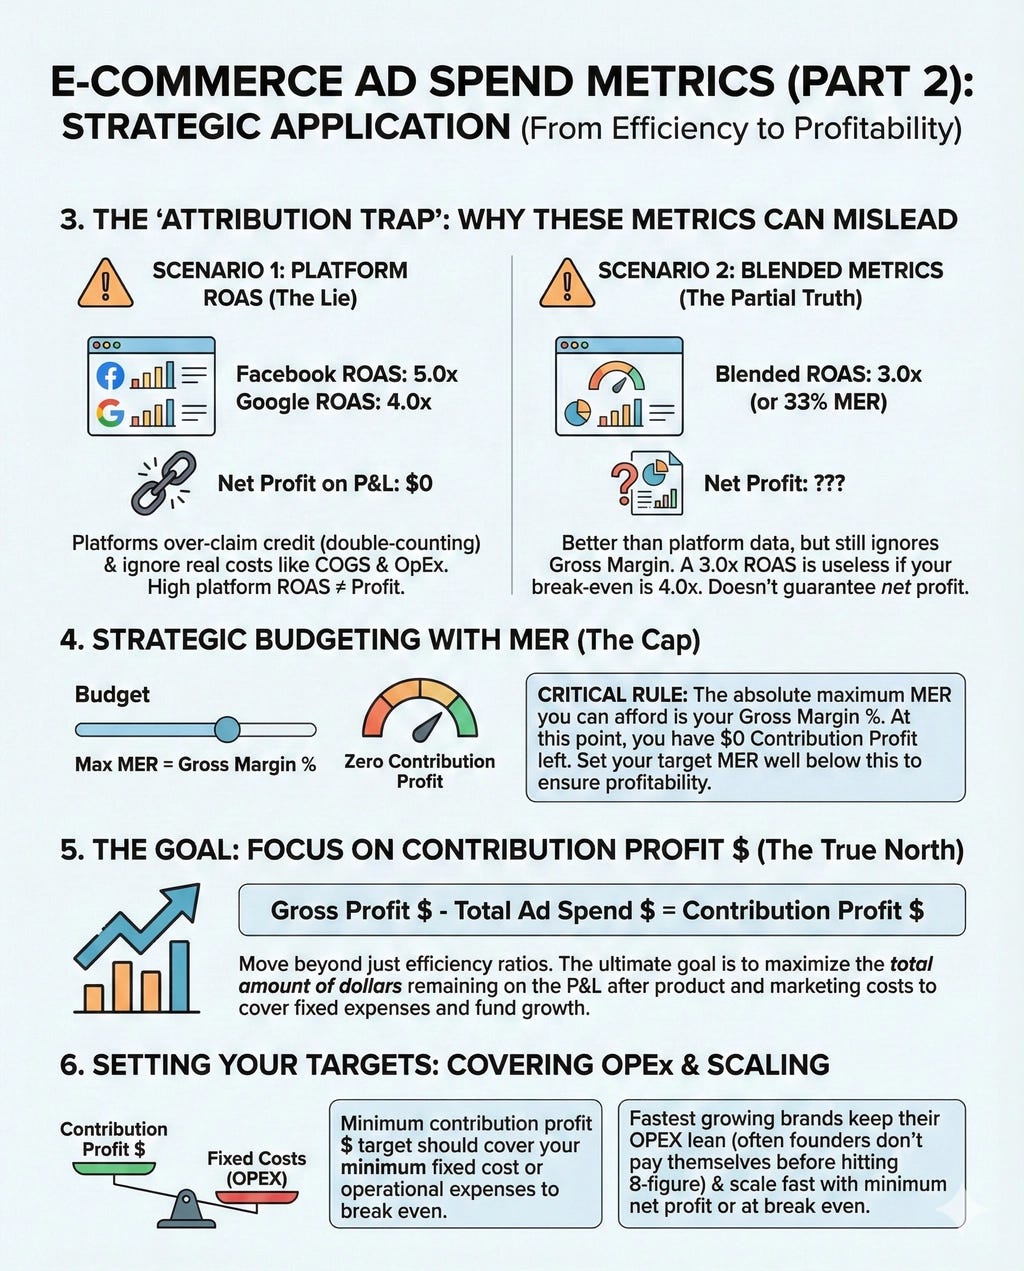
One of the biggest reasons many e-commerce brands don’t reach their full potential is that they miss a simple, common-sense point:
Selling more increases net sales and generates more contribution profit. This, in turn, can lead to a higher budget for operating expenses or a higher net profit, or both.
So why aren’t they scaling simply because they think their MER or blended ROAS isn’t good enough, especially if they have the inventory and capital to fund growth?
For example, this brand has $2M+ in monthly revenue on Amazon (that means they have inventory and capital), but their Shopify revenue remains below $100K per month, while they worry about protecting their 9+ blended ROAS.
Check from the table below how they can scale more and generate more contribution profit dollars at the highest spend level, even if their blended ROAS goes down.
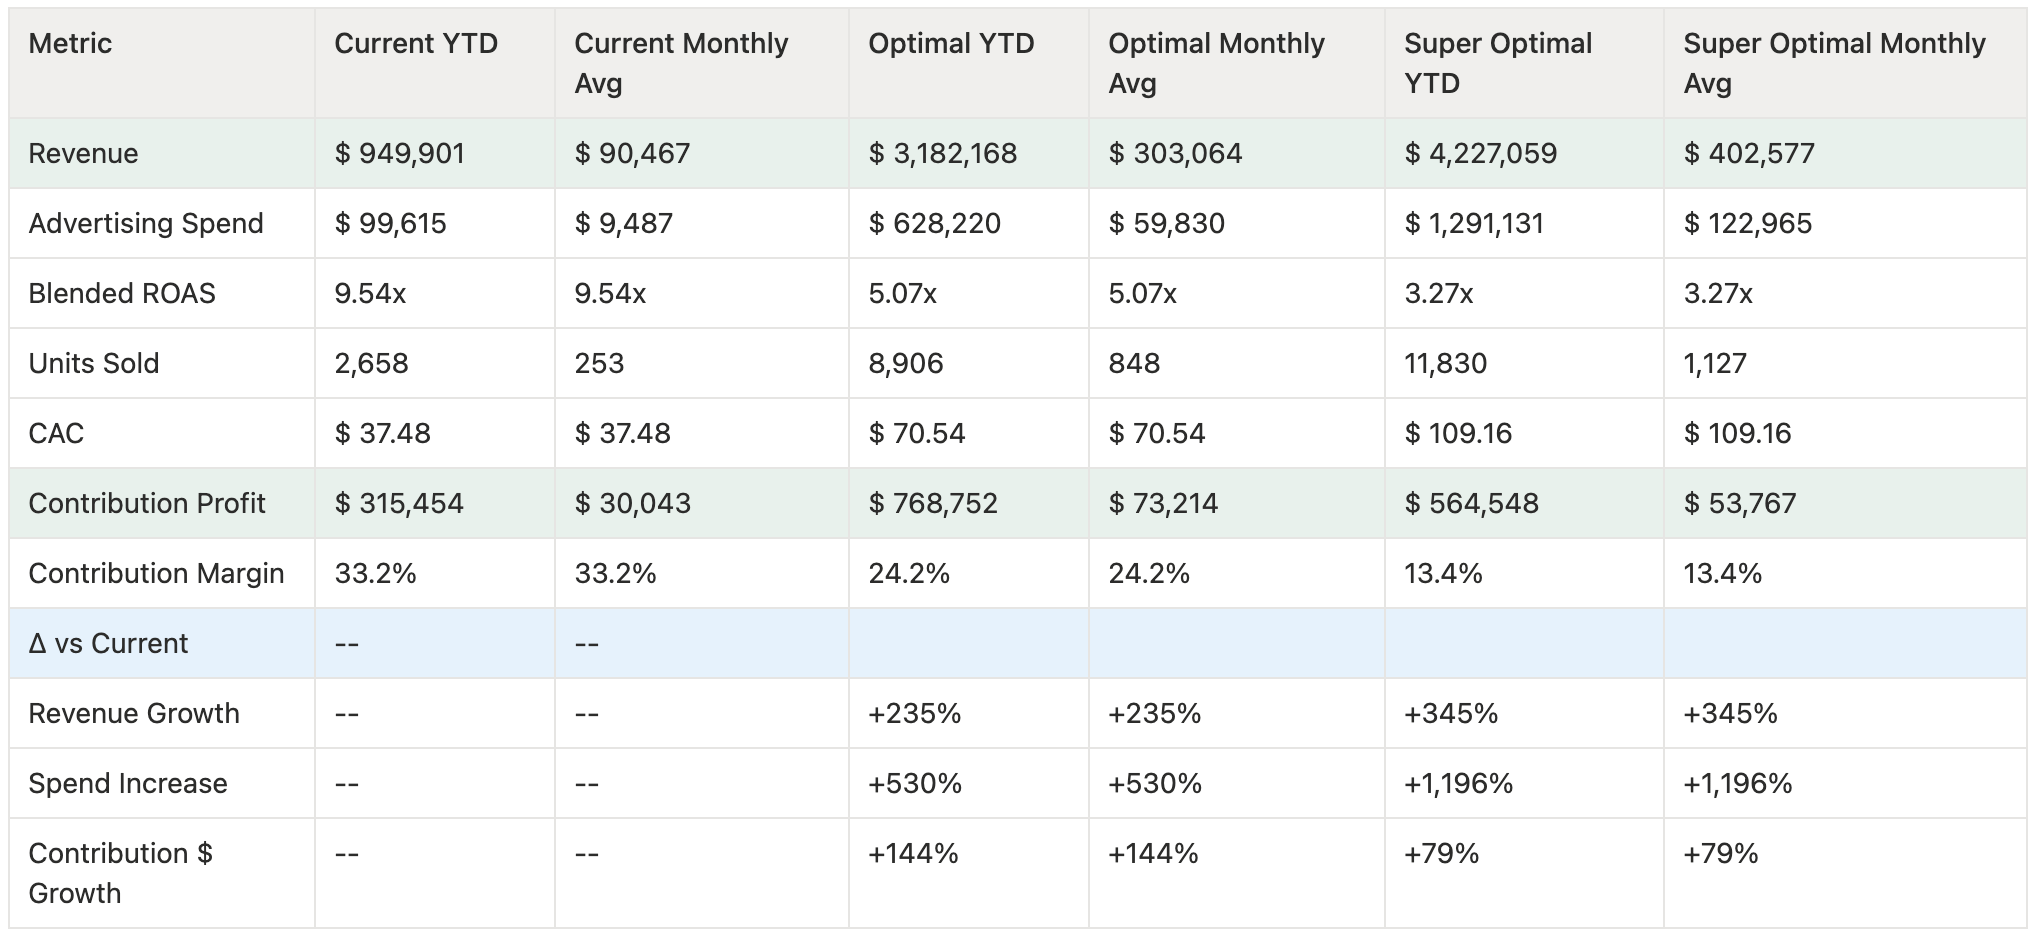
Use this Google sheet calculator shared by Ridge CMO to check possibilities for your brand.
Operational Expenses (OPEX) - Fixed Cost
I wish I could tell you how many 7‑figure+ brands do not have a clear idea about their monthly operational expenses.
OPEX consists of:
Personnel Costs (Salaries, wages, and benefits for your team.)
Tech Expenses (SaaS tools, subscriptions, platforms used to run the business.)
Other Agency/Marketing Costs (Agencies, freelancers, creative support not included in Ad Spend.)
Other General & administrative expenses.
Concerning patterns:
Bloated OPEX. The fastest-growing DTC brands aim to keep OPEX below 10% of net sales. Be ruthless about cutting tech and team costs that don’t meaningfully contribute to sustenance or growth.
Not operating at the required scale to generate enough contribution profit to cover non‑negotiable OPEX.
This is why I recommend the following framework to keep the OPEX lean yet build the marketing and growth strategy to scale beyond seven figures.
Bootstrapped eCommerce founders: Unlocking the eCommerce Growth Strategies to Scale Beyond 7 Figures

You've achieved what many dream of - a 7-figure business built on excellent products and happy customers. But now you're facing a common challenge:
Net Profit (EBITDA)
Net Profit = Contribution Profit - OPEX
Goal: As you grow your top line month over month and year over year,
In the best case, generate more net profit.
Conservatively, maintain an acceptable net profit.
For aggressive scaling with the confidence of future profitability, at an acceptable net loss.
Must have Monthly report for eCommerce Founders.
You can use this template from CTC to maintain a comprehensive P&L report like below:
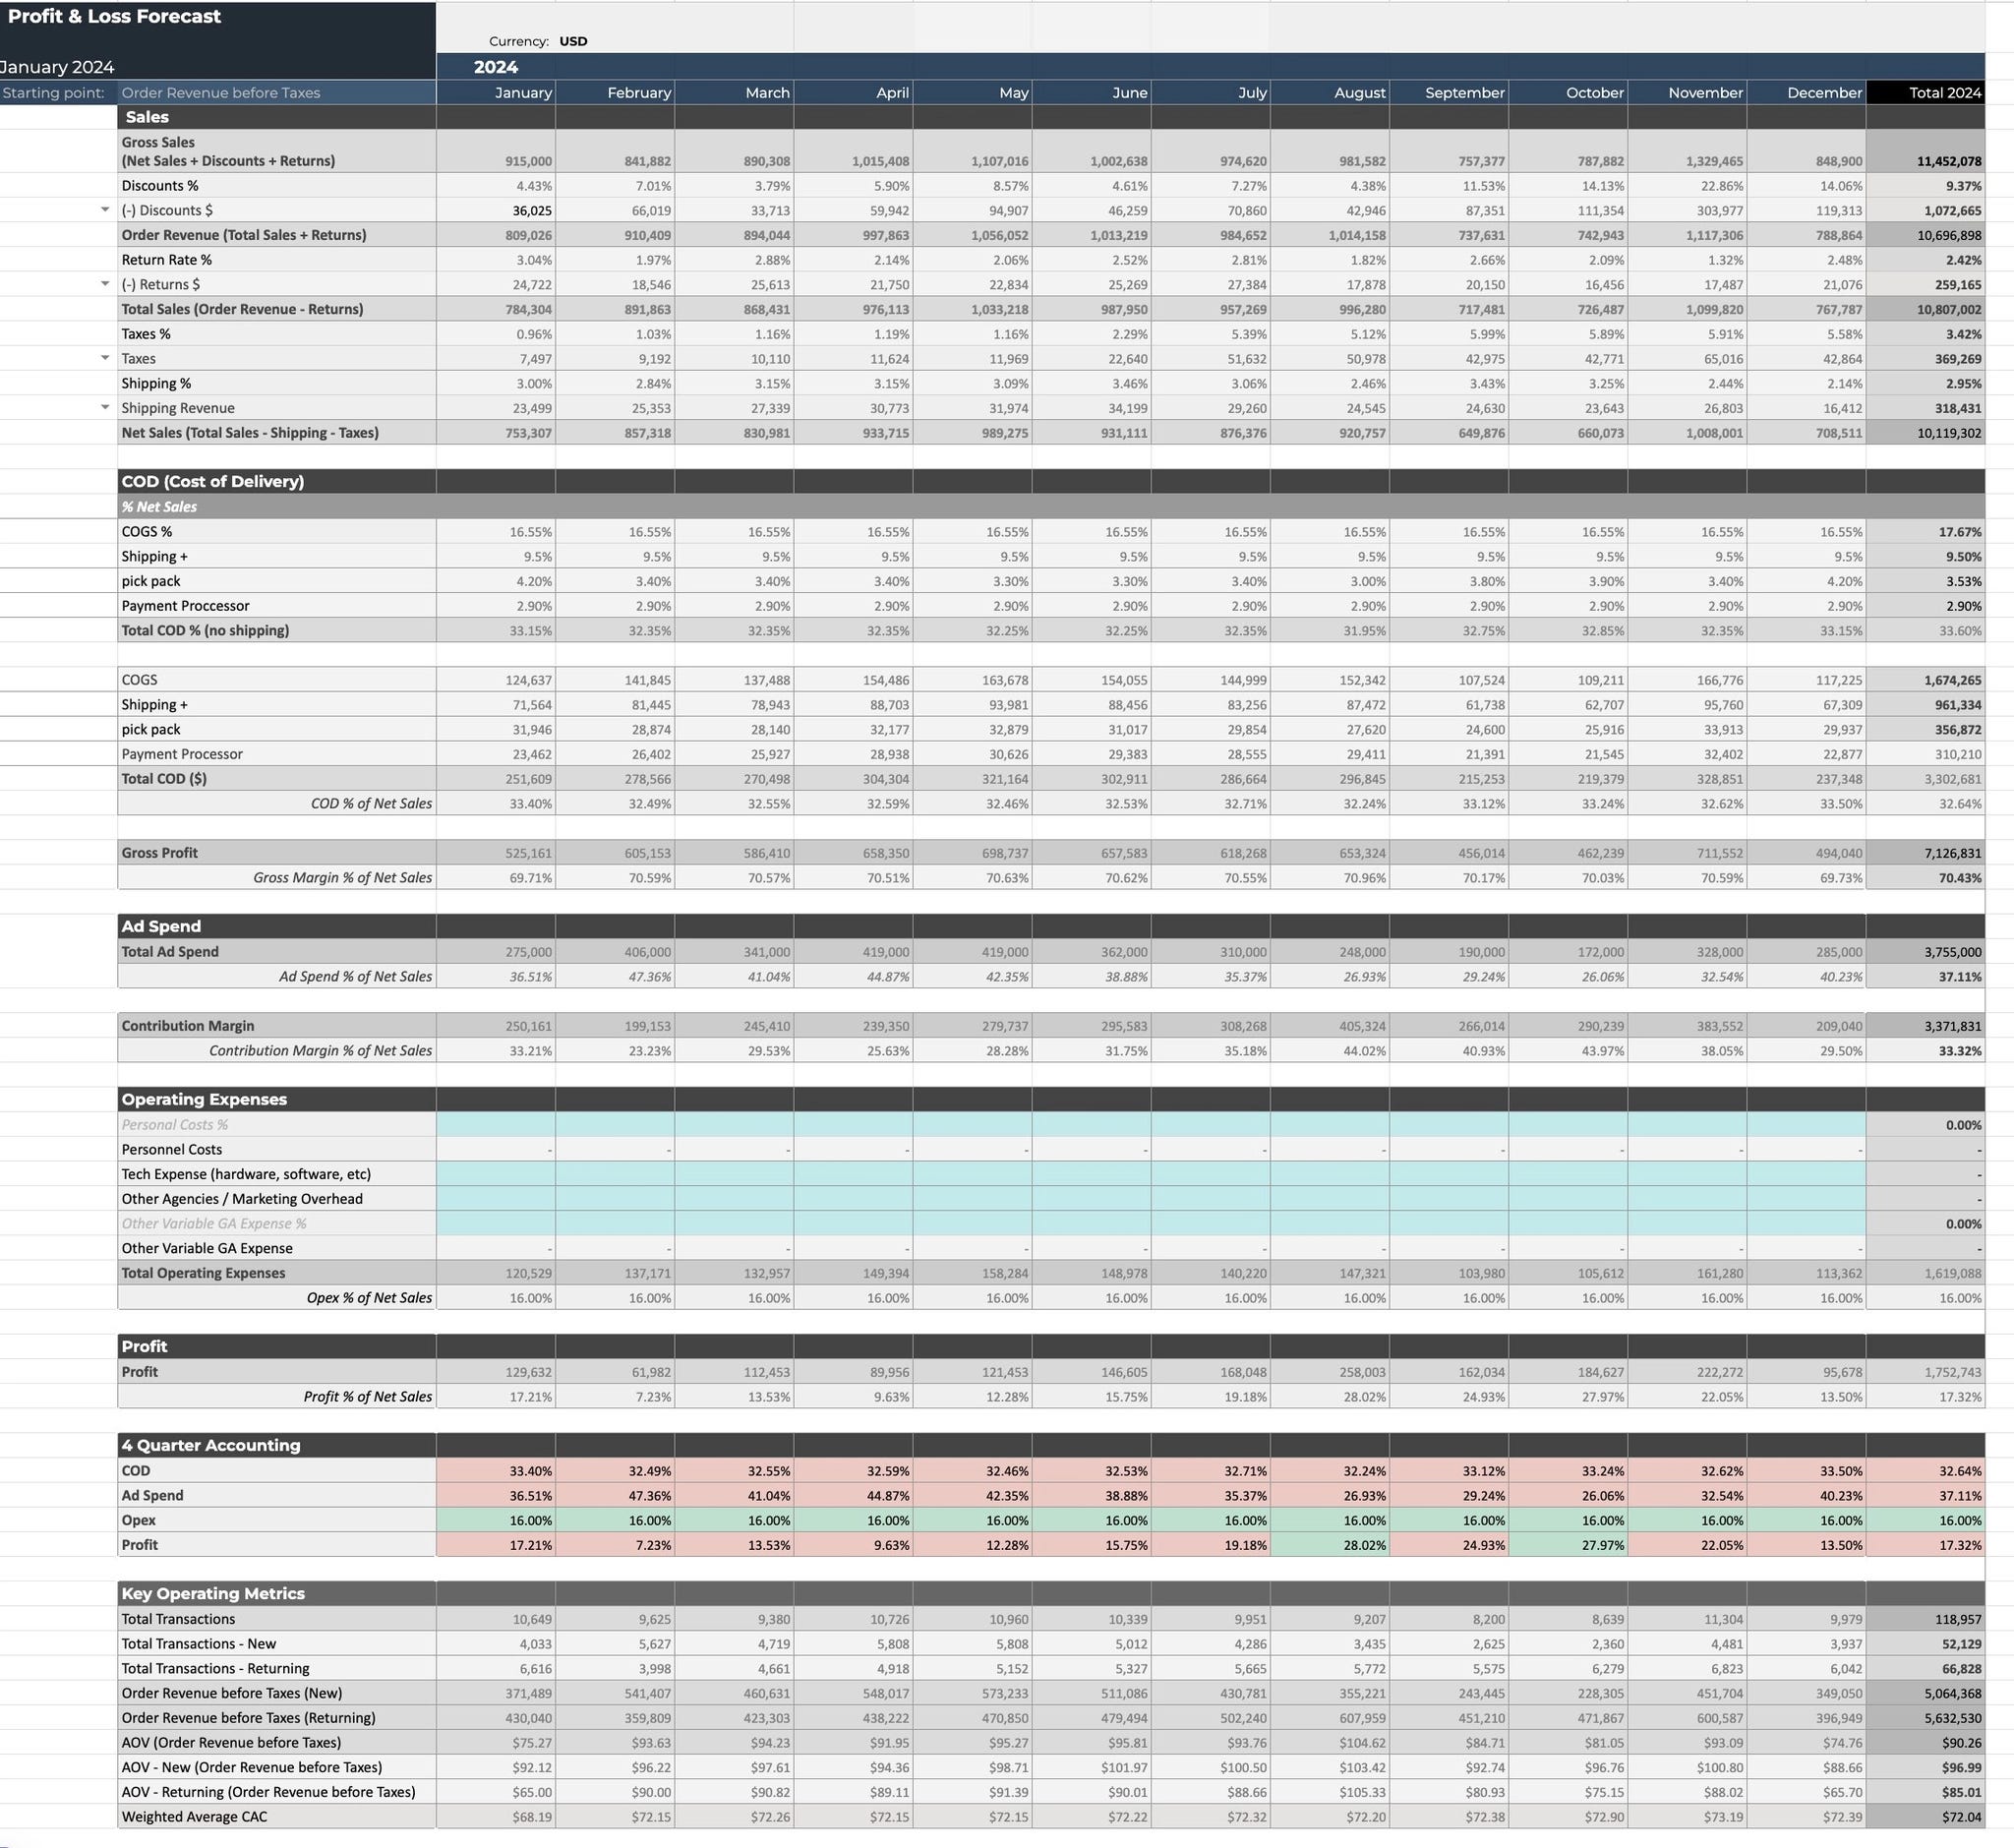
If that looks intimidating, start a spreadsheet with something as simple as:
Month | Net Sales | COD | Gross Profit | Ad Spend | Contribution Profit | OPEX | Net Profit
How difficult is it to maintain this monthly table?
eCommerce Profit Tracking Platforms
You can create this in Google Sheets within the next hour if you don’t have this already.
Then, if you are using AI tools like ChatGPT or Claude, you can take their help to build and maintain this table very easily.
Depending on the stage of your business, many platforms and services can generate this report automatically, so you don’t have to maintain it manually.
Kleio is great to start with at $29/m. (Find founder @MattiSchroder on X)
Storehero has more, starting at $179/m for brands with last 12-month revenue <$1M.
Finaloop (robust eCommerce finance software + bookkeeping service) starting at $245/m for brands with projected 12-month gross revenue <=$1.4M
Don’t hesitate to reach out if you need an introduction with Storehero or Finaloop team. I would be happy to make an introduction and help you get started with the best offers I have access to as a partner.
Profit ≠ Cash
Once you master the above P&L, the next step in your journey to mastering DTC finance is understanding cash flow.
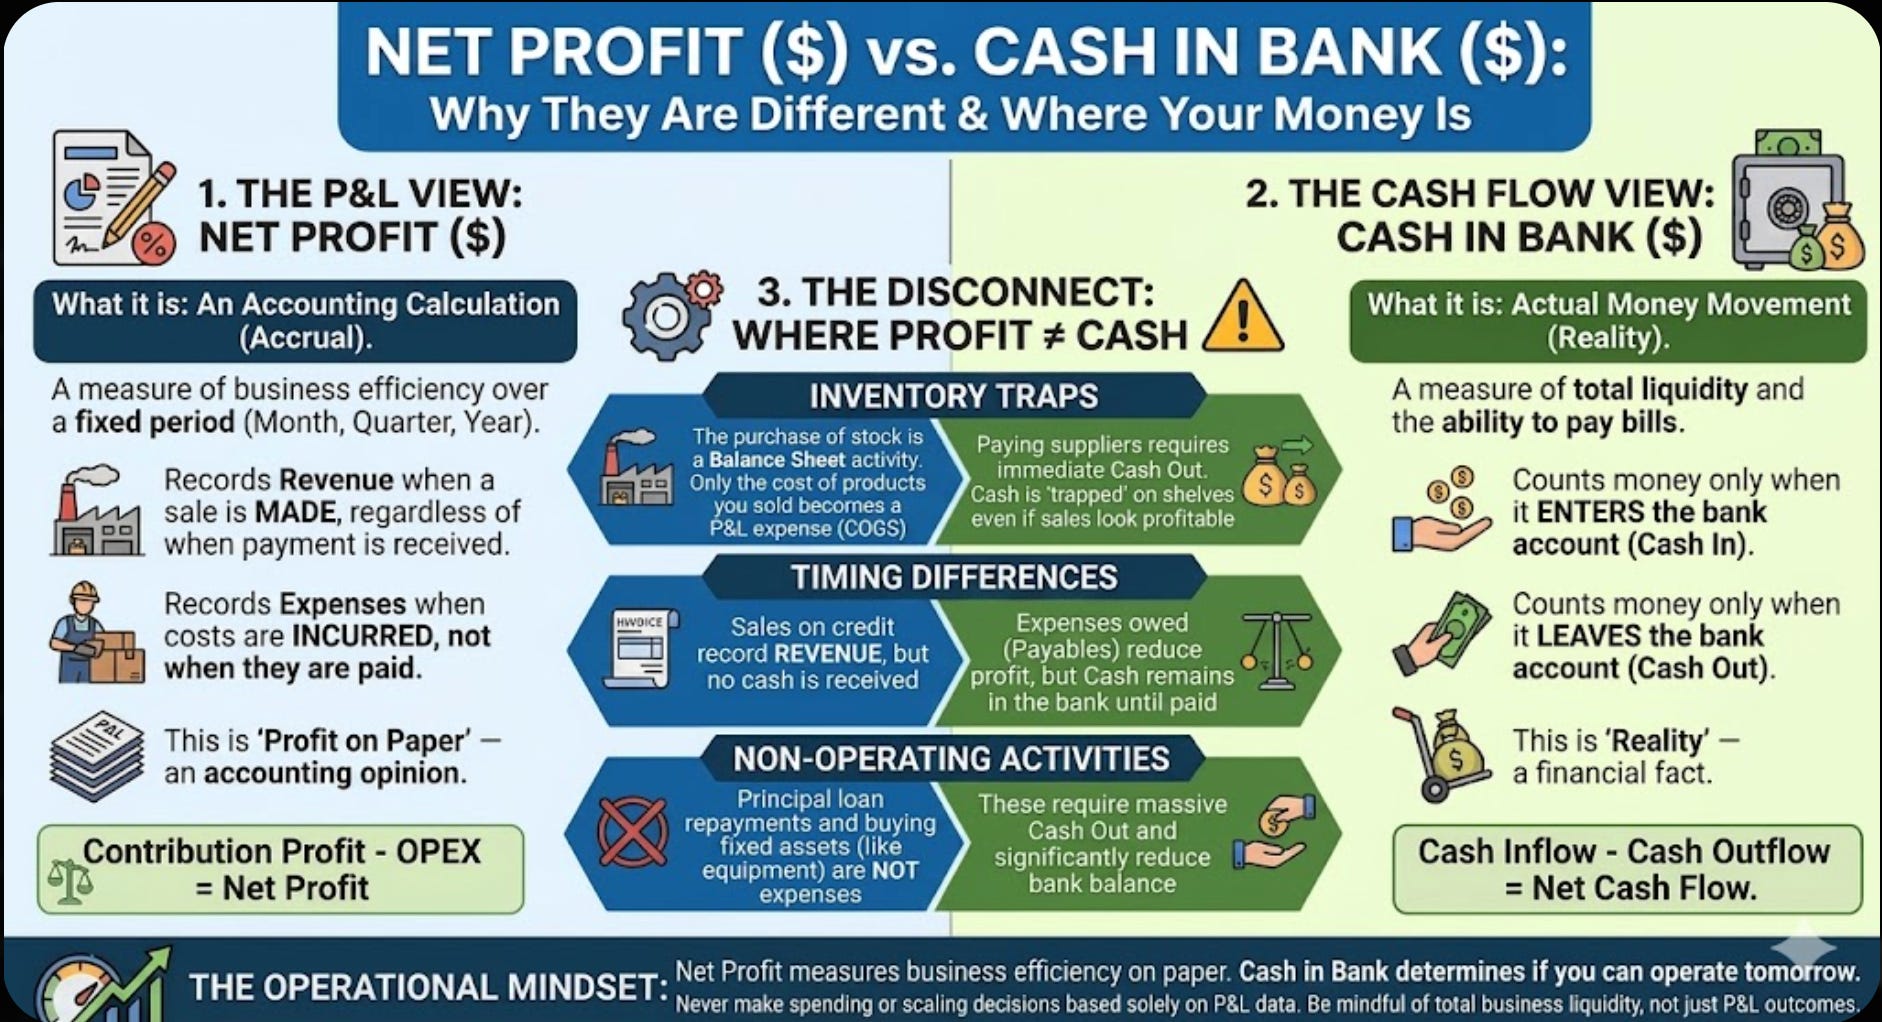
Check the following article I published earlier to understand how profit can be misleading if you don’t understand cash flow.
The Hidden Cost of Cutting Ad Spend: Why Your P&L Says Profit But Your Bank Account Says Panic

You’re staring at your dashboard at 11 PM. Your profit margins are barely in the double digits. Your MER is sitting at an ugly 56%. You’re spending more than half your revenue on ads just to keep the lights on. Your CFO (or accountant, or that voice in your head) is saying the same thing everyone says: “We need to get more efficient. Cut the ad spend. F…
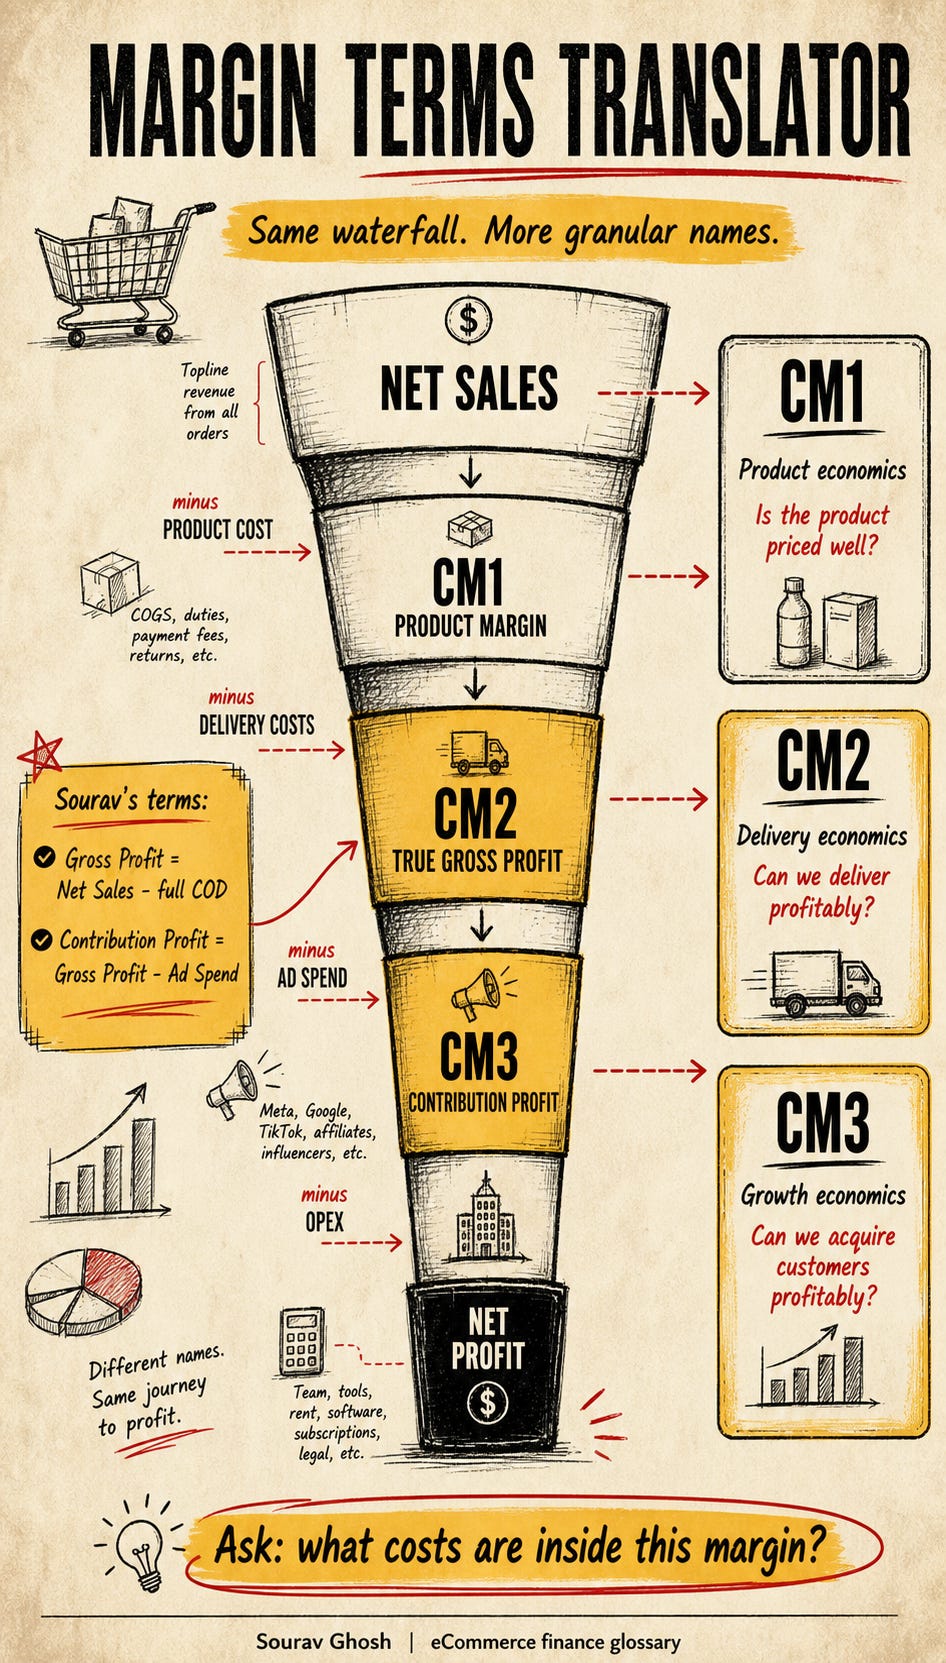
What are CM1, CM2, CM3?
Don’t be confused if you see CM1, CM2, or CM3 used instead of how I’ve defined Gross & Contribution Margin.
The infographic below will help you connect my terms with CM1, CM2, and CM3.
If you want to dig deeper, read CM1, CM2, CM3: Measuring Profitability as Business Complexity Scales.
I want you to generate more revenue, profit, and cash this year.
And I hope this article takes you one step closer to that.
I hope this article makes eCommerce finance concepts easier to understand and encourages you to spend more time focusing on real business numbers rather than vanity metrics that shouldn’t be your priority as the owner.
DTC community and the knowledge sphere are too crowded with discussions related to Meta ads, creative strategies, and CRO tactics, while the financial foundation gets overlooked.
Let’s change that.
Let’s have more conversations, discussions, and debates on what actually matters: the revenue, the profit, the money in the bank.
This is one of the better explanations of eCommerce finance I've read because it emphasizes the metrics that actually drive decisions, not just dashboard vanity numbers. The distinction between COGS and the full cost of delivery is especially important, many brands overestimate their gross margin and end up overspending on acquisition. I'd also add that reviewing contribution profit at the SKU level often reveals which products should acquire customers and which should primarily serve as upsells or cross-sells.